









Research-grade notes for sound, vibration and predictive maintenance teams.
Articles on controlled fault generation, wireless sensor validation, machine condition monitoring labs and practical signal workflows.
 Interactive
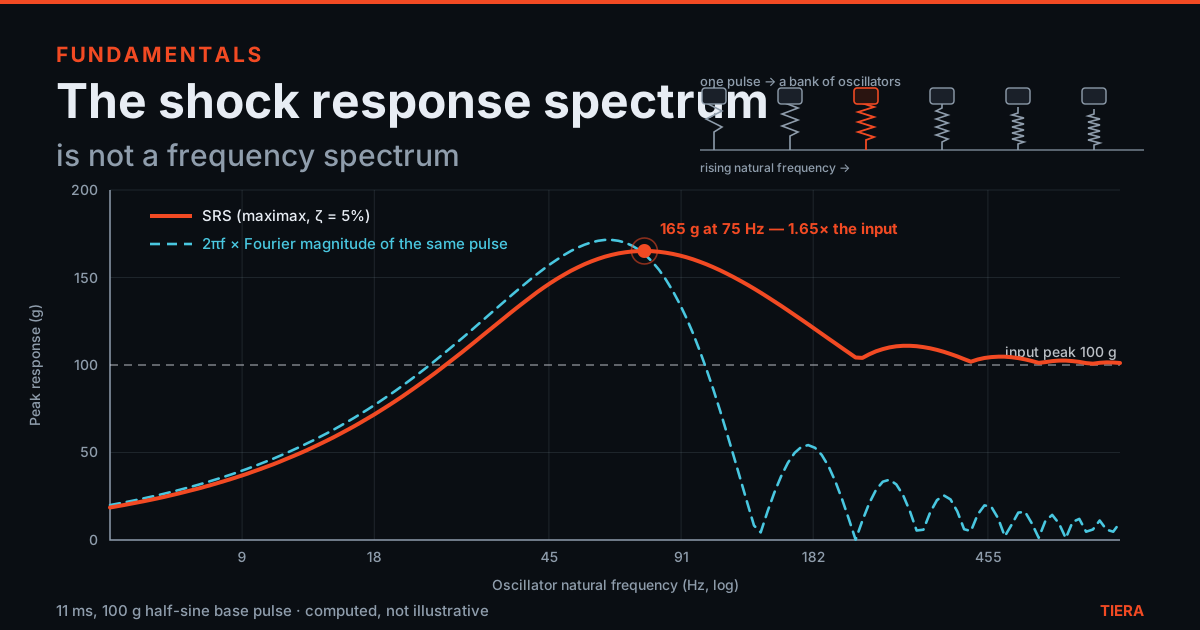
The Shock Response Spectrum Is Not a Frequency Spectrum
An SRS looks like a spectrum and is plotted like a spectrum, but it is not a decomposition of the pulse into frequencies — it is the worst thing a bank of imaginary oscillators ever felt. Build one live from a pulse you choose, watch the pulse's own Fourier magnitude diverge from it on the same axis, and compute a drop-shock level from height and pulse width.
 Interactive
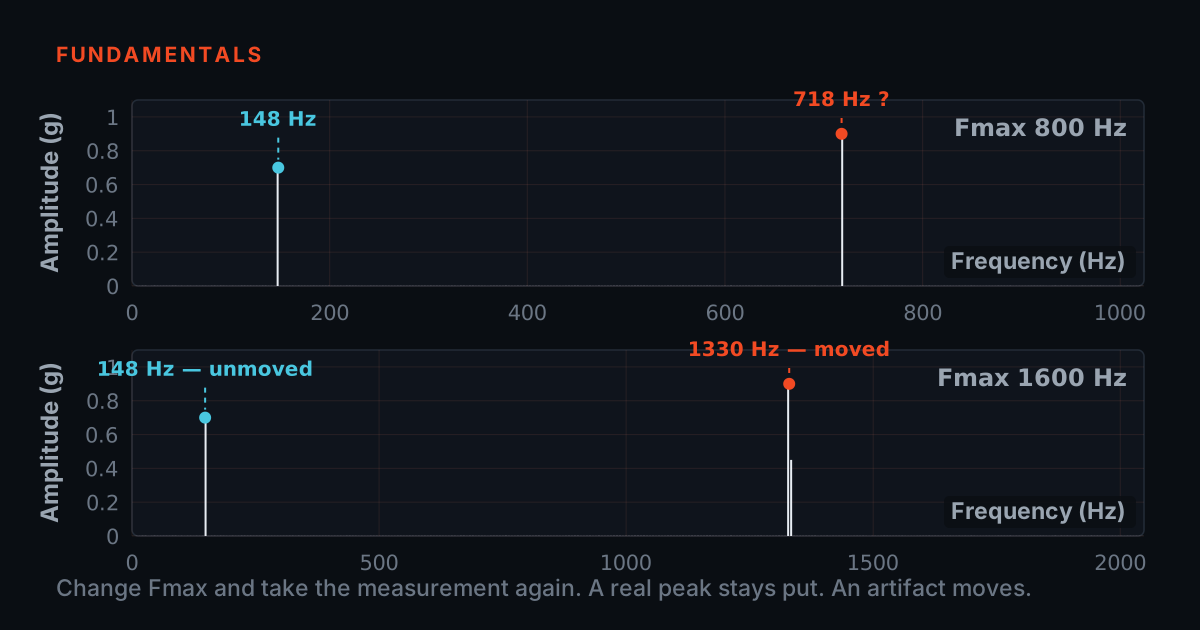
Is It the FFT's Problem or the Machine's? The Peak That Moves When You Change a Setting
Half of what analysts call a fault is the transform talking. This post gives every artifact a test you can run in sixty seconds: change one acquisition setting and see whether the peak moves. Two live simulators, every number computed rather than quoted — including three results that contradict the usual telling.
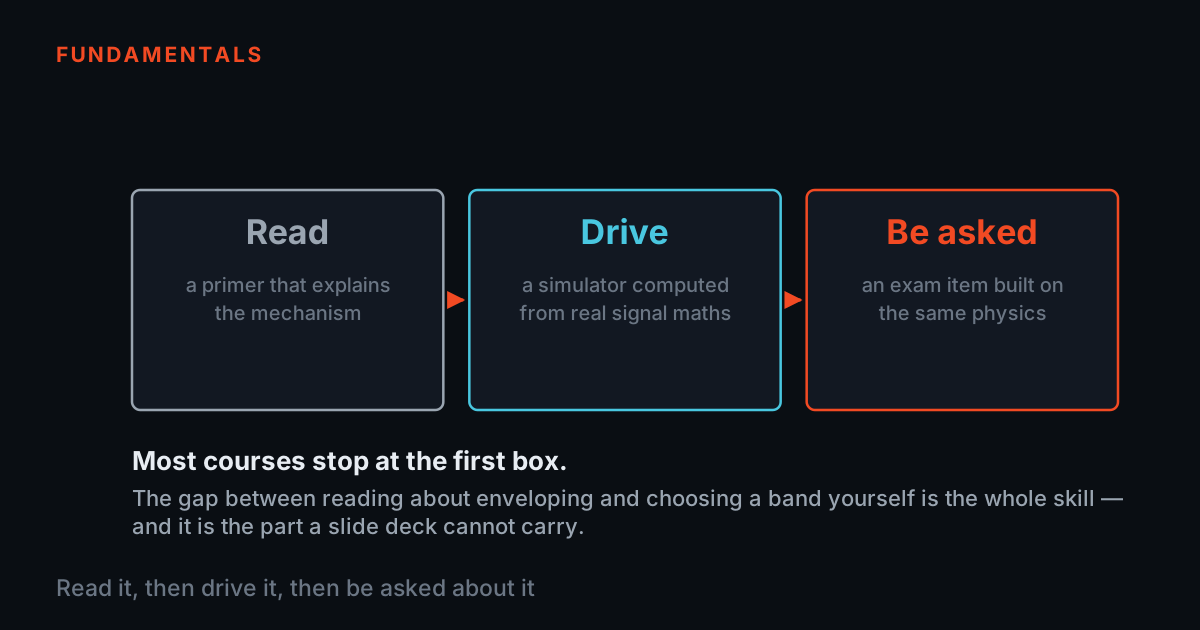
TIERA 101: Why a Free Vibration Programme Is Worth Your Time
Ten free courses, 359 lessons, 211 simulators you actually drive — built by the people who build the instruments. What TIERA 101 is, what it honestly is not, and why both plants and universities are using it.
 Interactive
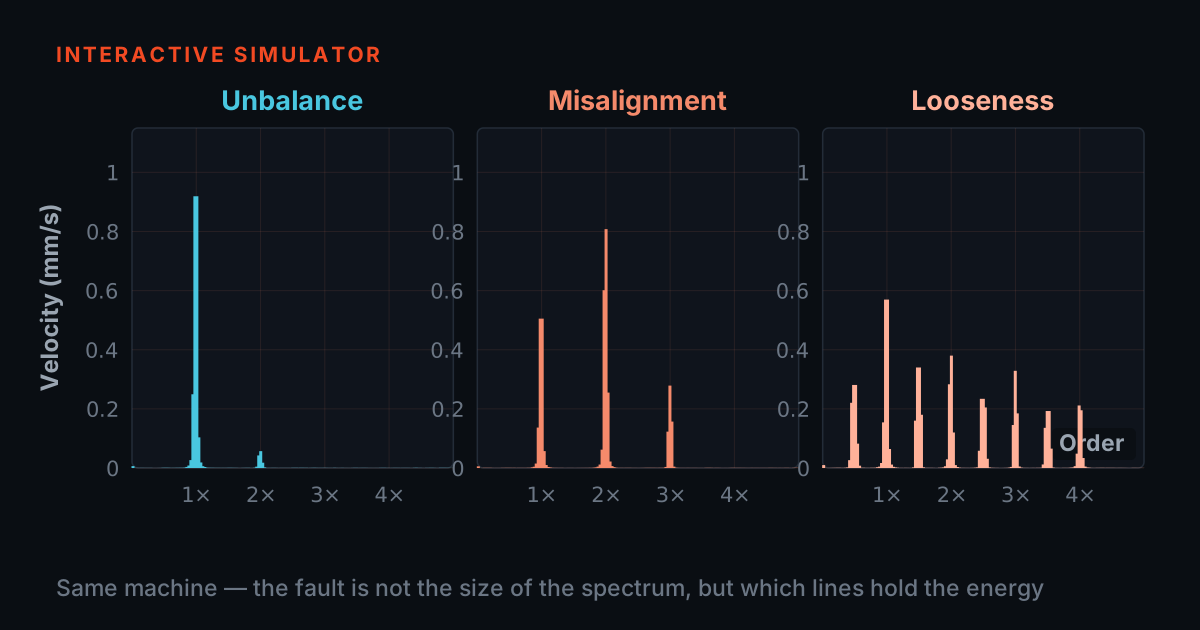
Build the Spectrum Yourself: What Unbalance, Misalignment and Looseness Actually Look Like
An interactive mini-explainer: assemble a machine's vibration from its parts — 1x, 2x, a harmonic comb — and watch the time waveform and spectrum change live. Learn the three classic signatures by driving them.
 Interactive
Catch an Alias in the Act: A Live Sampling Playground
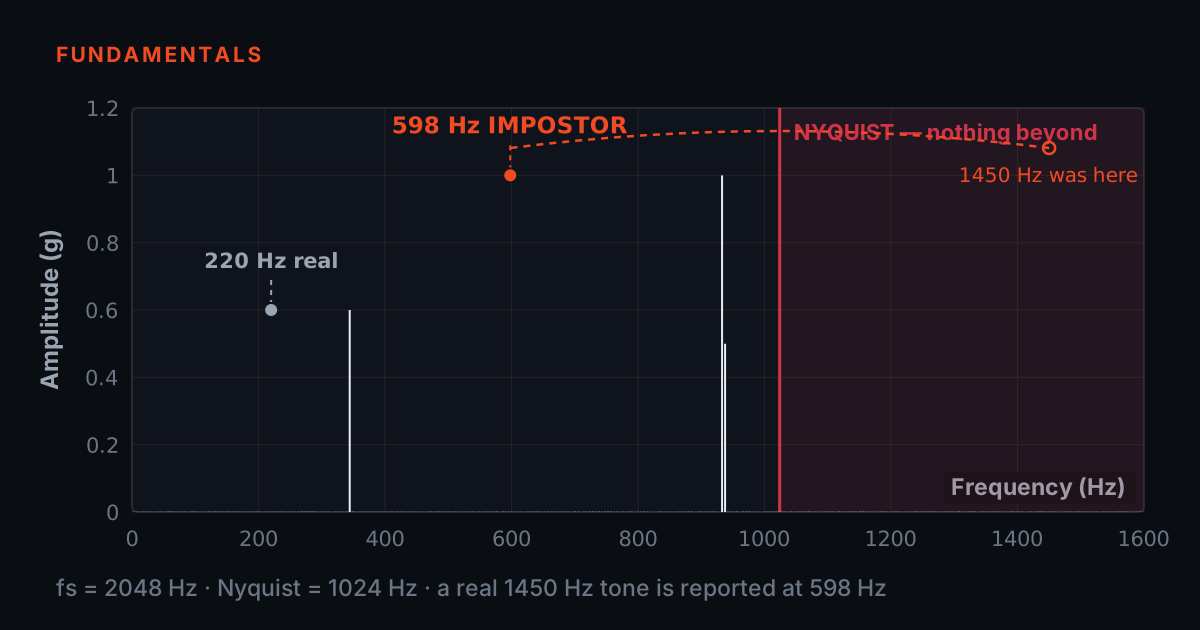
Our aliasing explainer told you why undersampled signals lie. This one lets you make them lie: two sliders, a live plot of the true signal, the stored samples and the false reconstruction, and a readout that computes the fold as you cross Nyquist.
 Interactive
Why Your Peak Is the Wrong Height: Windows, Leakage and the Honest Amplitude
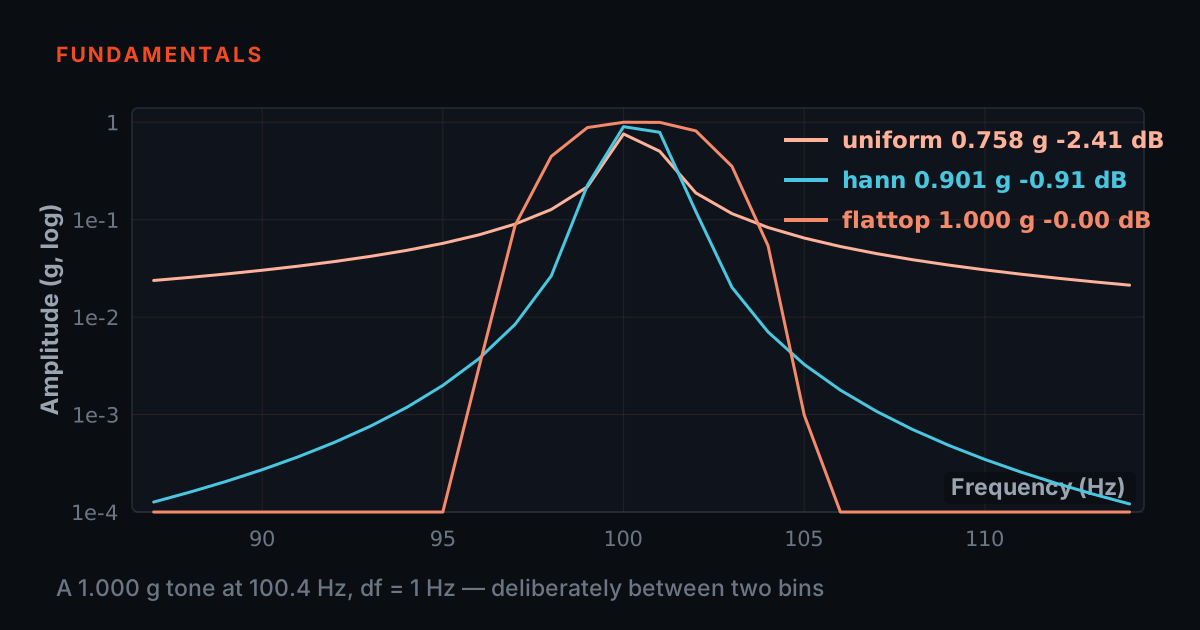
The FFT quietly assumes your record repeats forever — and when a tone doesn't fit the record, its peak drops and smears. A visual walk through leakage, scalloping and coherent gain, with a live comparator: pick a window, slide the tone off a bin, and watch the measured amplitude lie or hold.
 Interactive
Why a Shock Reading Lies — and How to Tell That It Lied
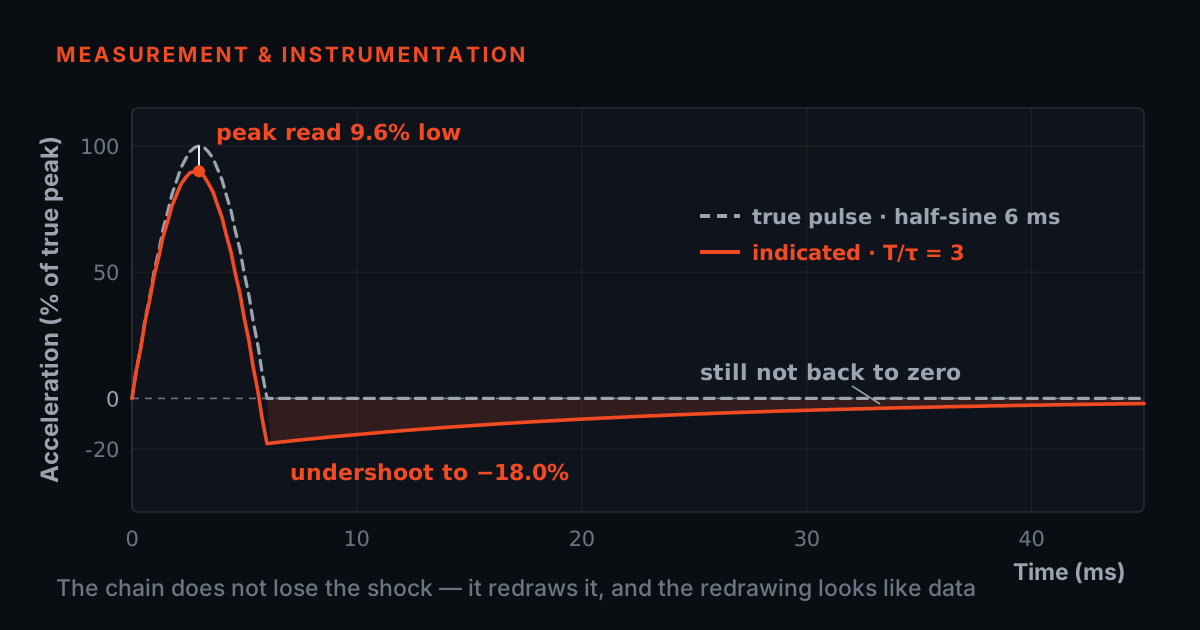
A transient gets no second chance: you record it once, and every distortion the chain adds arrives looking exactly like data. Two live simulators — drive the high-pass time constant until the error crosses 5% and 2% and read the ratio you need, then take the sensor over range and watch the baseline walk off zero while the integrated velocity marches away.
 Interactive
Where the Calibration Chain Actually Begins
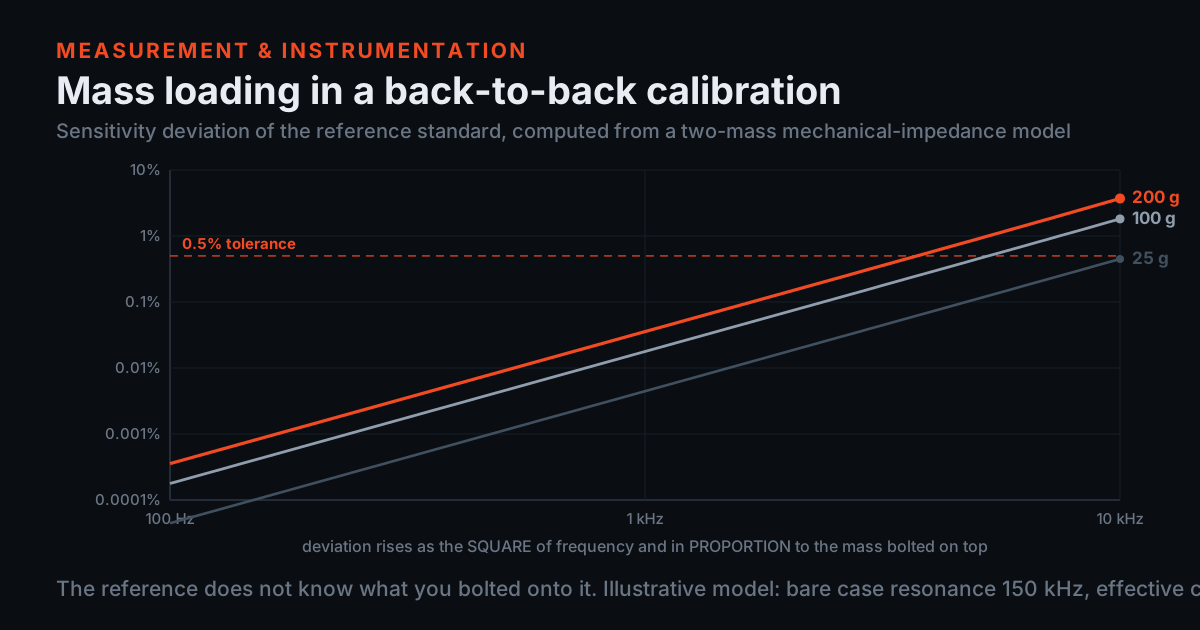
A comparison transfers a sensitivity; it never creates one. This is the layer beneath the traceability chain: absolute (reciprocity) calibration, which needs no reference sensor at all, and the mass-loading error that quietly biases every back-to-back comparison built on top of it. Drive the model and find the UUT mass your own tolerance can afford.
 Interactive
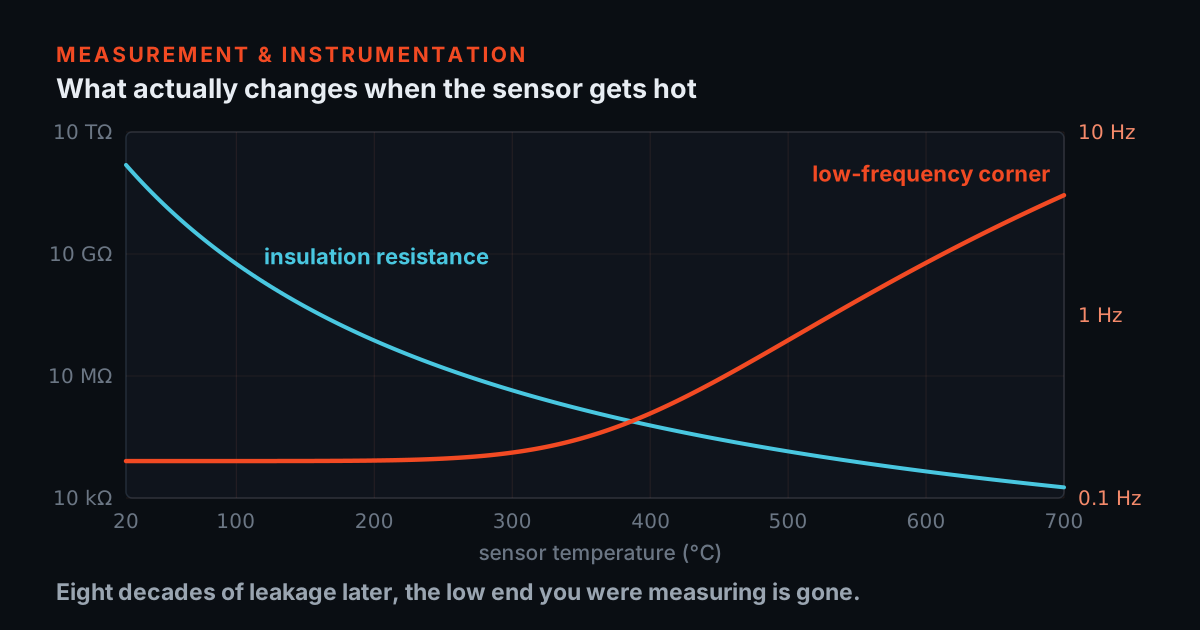
What Actually Changes When the Sensor Gets Hot
Above about 120 °C the amplifier inside an IEPE accelerometer, not the crystal, is what quits — which is why hot work goes back to charge mode. Then the ceramic starts leaking, the low-frequency corner walks up the axis, and the crystal begins generating charge out of temperature alone. Two simulators let you drive all three effects.
 Interactive
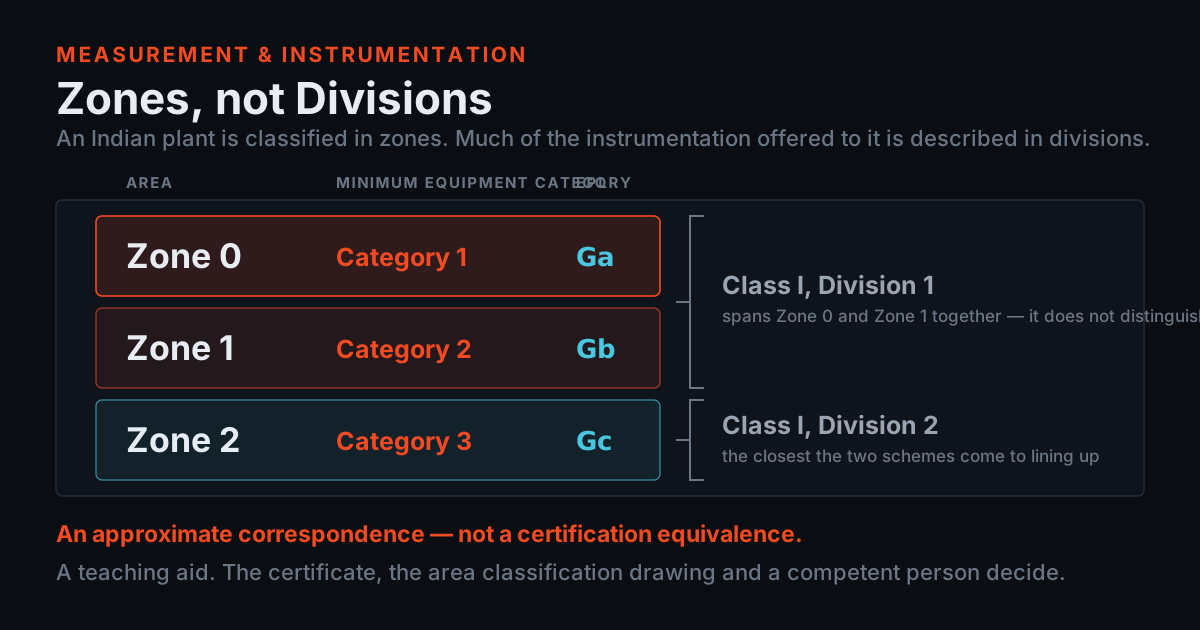
Hazardous-Area Vibration Sensing: Zones, Not Divisions
An Indian plant is classified in zones. A great deal of the instrumentation offered to it is described in divisions. Buying across that gap is one of the most expensive procurement errors in condition monitoring — and it is entirely avoidable once you can read a marking string field by field. A decoder you can drive, and a straight account of why intrinsic safety is a property of the loop rather than of the sensor.
 Interactive
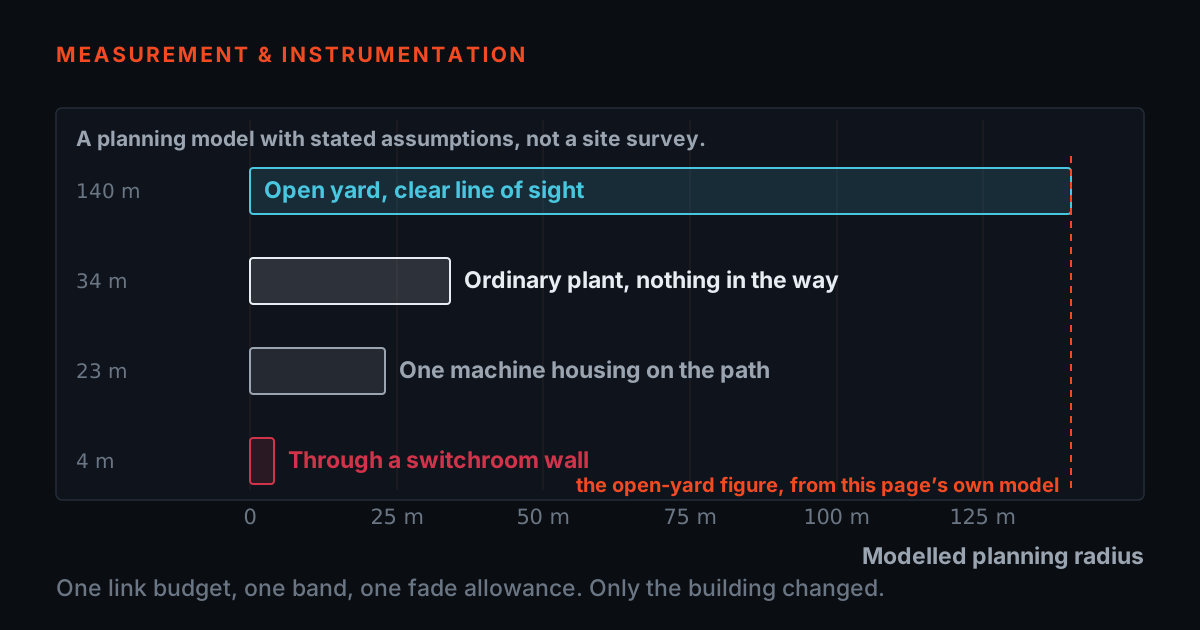
Planning Wireless Gateway Coverage: Range, Walls and Sensors per Gateway
A line-of-sight range figure is not a plant range figure, and mistaking one for the other is the most expensive error in wireless condition-monitoring procurement. A stated path-loss model you can drive, so you can watch how fast steel and distance eat a link budget — and a straight answer on how many sensors one gateway really carries.
 Interactive
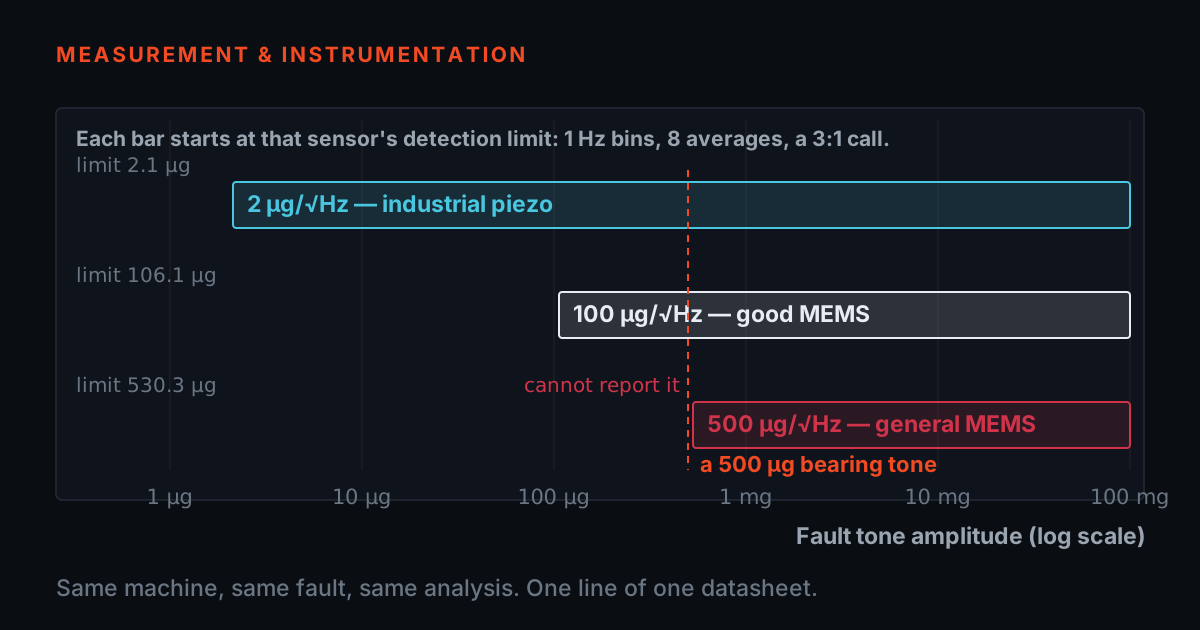
What a MEMS Noise Floor Costs You, in Detectable Fault Size
Micro-g per root hertz is the least-read line on a wireless sensor datasheet and the one that decides whether it will ever see your bearing fault. Four lines of arithmetic turn it into a fault size in micro-g — with a bench that computes the limit, prices it in seconds of battery, and tells you plainly when the answer is no.
 Interactive
How Long a Wireless Vibration Sensor's Battery Actually Lasts
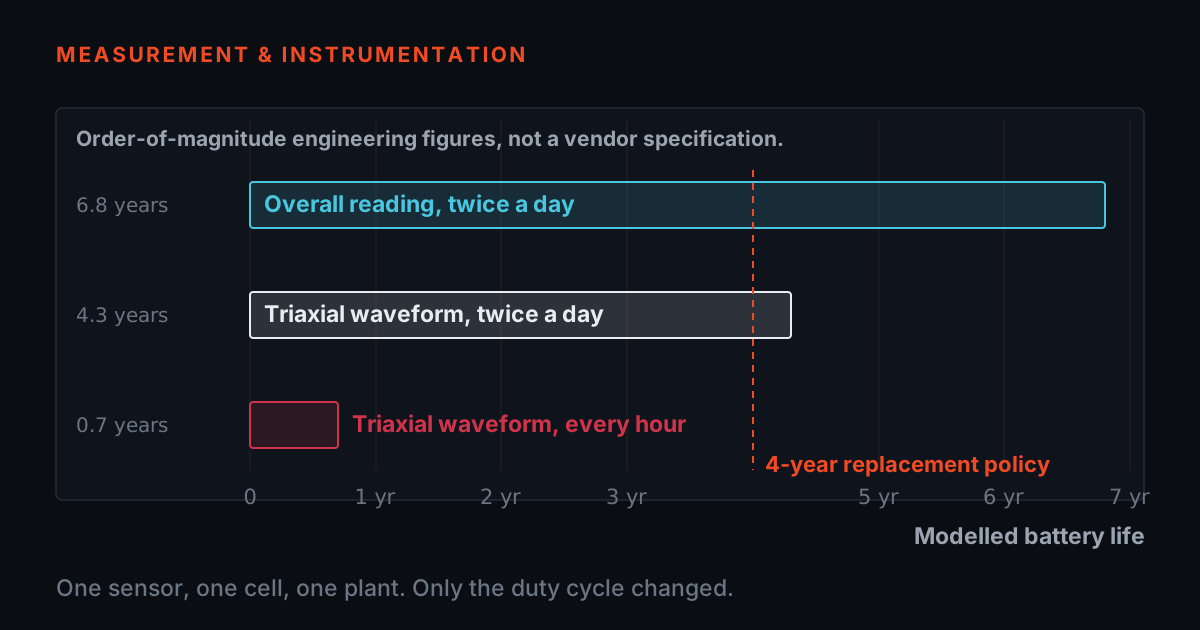
Every wireless sensor datasheet says one to four years, and every one of them is right, because battery life is not a property of the sensor — it is a property of what you ask the sensor to do. Four energy terms, one division, and a bench that itemises them, so you can see which term is eating your battery and what to change.
 Interactive
The Mount Is Part of the Instrument: Magnets, Pads and Studs for Wireless Sensors
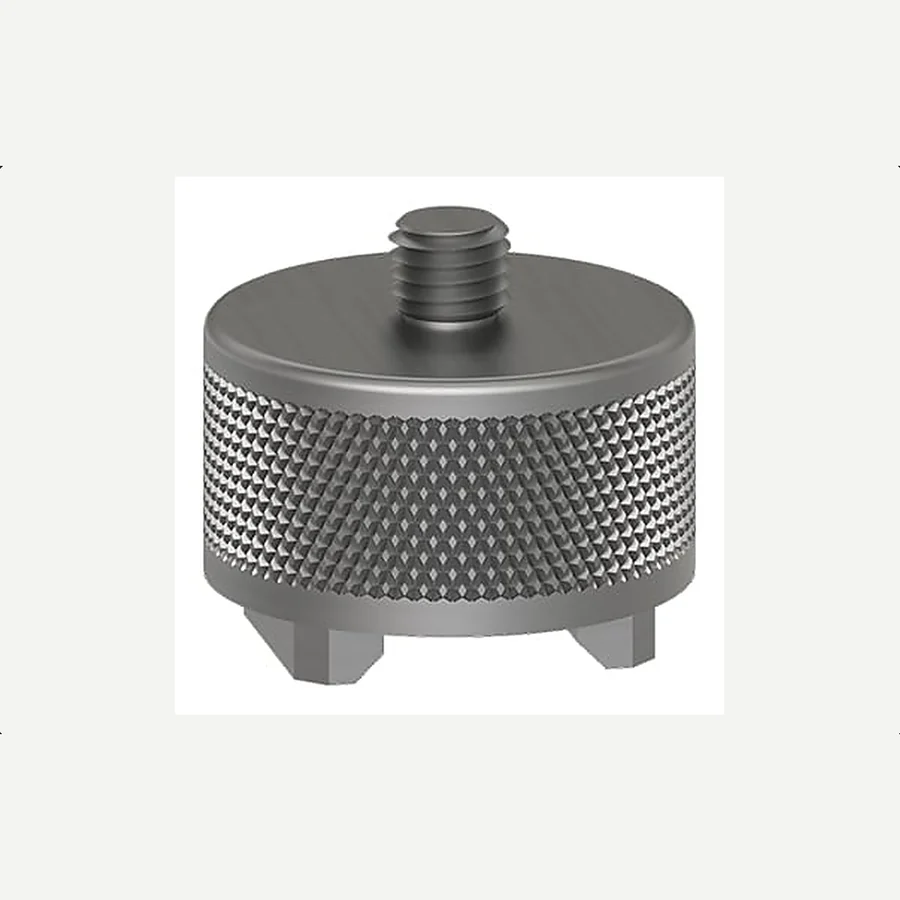
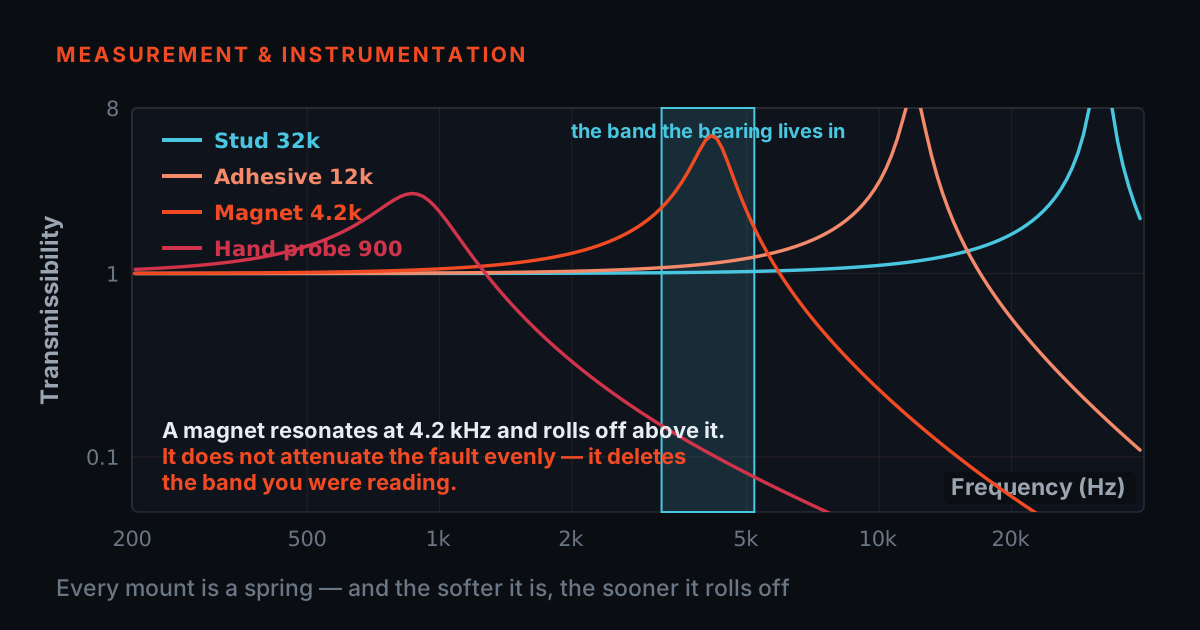
A wireless vibration node is a spring-mounted mass, and the spring is whatever you put between it and the machine. Stud, adhesive pad, flat magnet, curved-surface magnet, magnet-on-paint — each has a mounted resonance, and that resonance decides which frequencies reach the sensor honestly, which arrive amplified, and which never arrive at all. A driveable model, the paint trap, and the mounting hardware that fixes it.
 Interactive
Choosing an Industrial Accelerometer: Three Numbers That Fight Each Other
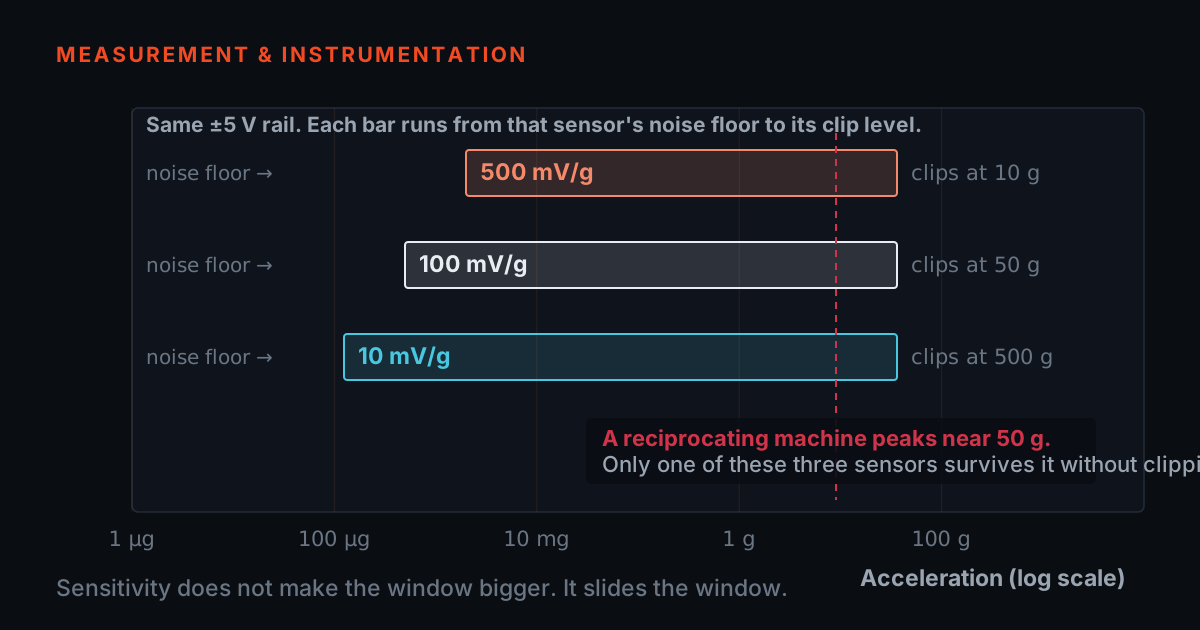
Sensitivity, dynamic range and noise floor are not three specifications to compare in a table — they are one decision, and improving any of them costs you another. A selection guide with a live bench that computes the clip level, the noise floor and the usable band, and refuses to price a measurement your mount cannot deliver.
 Interactive
Your Envelope Band Is Perfect. Your Sensor Can't Reach It.
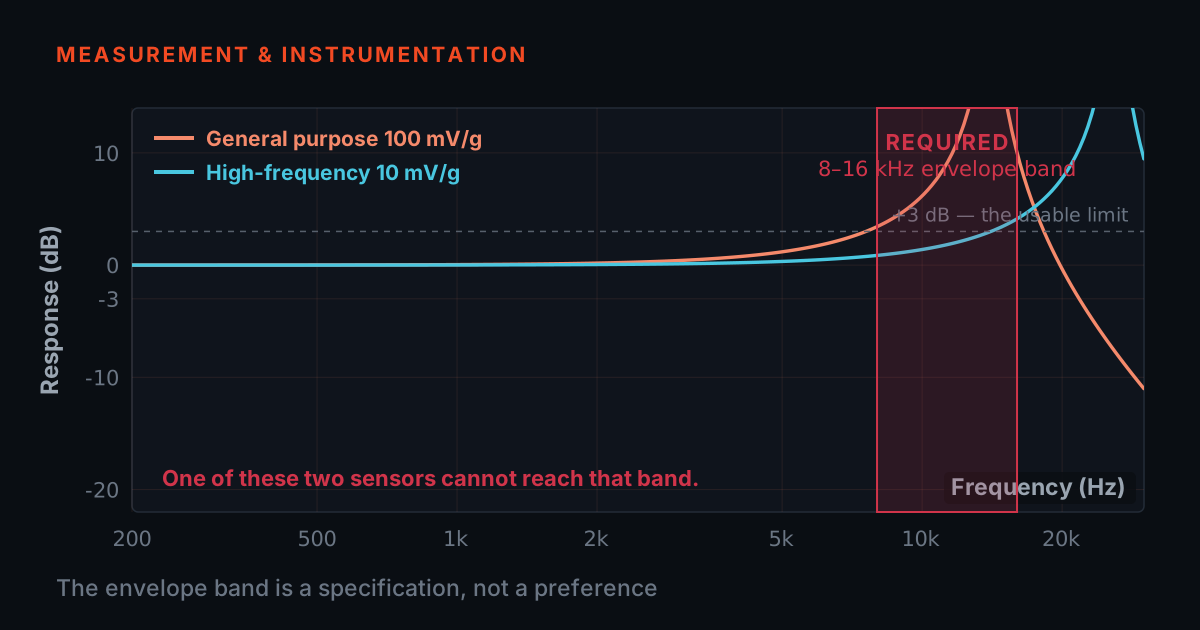
A boiler feed pump destroyed a bearing three weeks after a route that read perfectly clean. Nothing was wrong with the analysis. Everything was wrong with the instrument. Four simulators take the failure apart — reach, noise floor, headroom and the loop — across the eight IMI precision ICP accelerometers.
 Interactive
The Cable Is Part of the Measurement
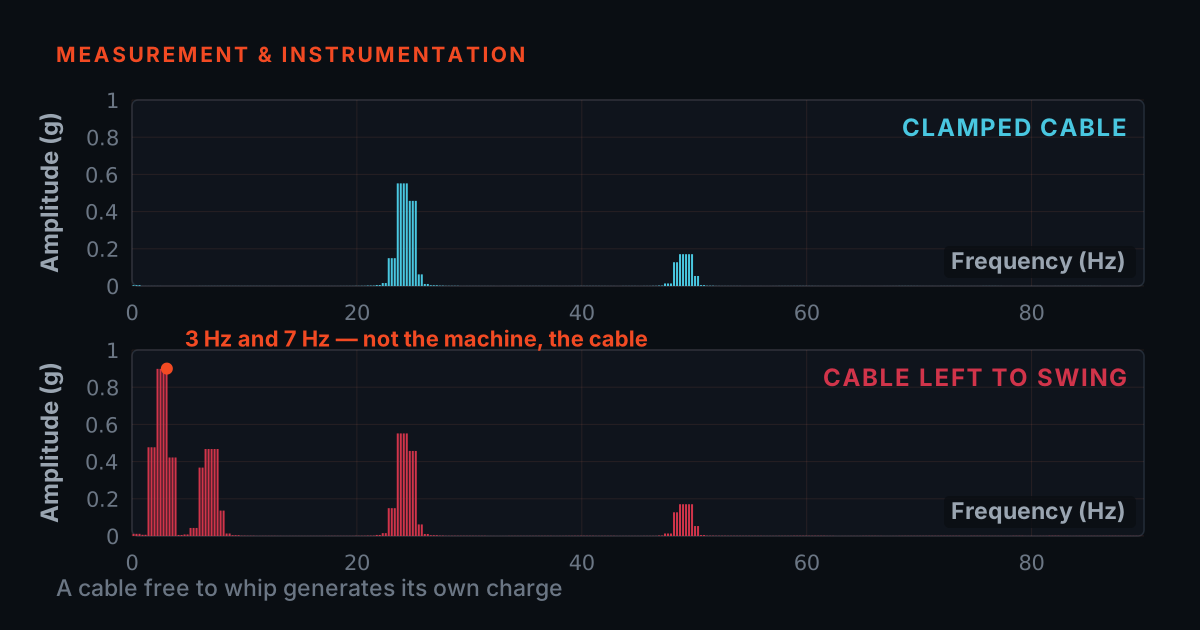
A vibration cable carries a signal of a few millivolts. Flex the wrong cable and it generates its own charge, burying the bearing fault you bought the sensor to find. What makes a cable good, how cable quality is tested, and why the cheapest cable is the expensive one.
 Interactive
Choosing a Magnetic Mount: Pull Force Is the Easy Half
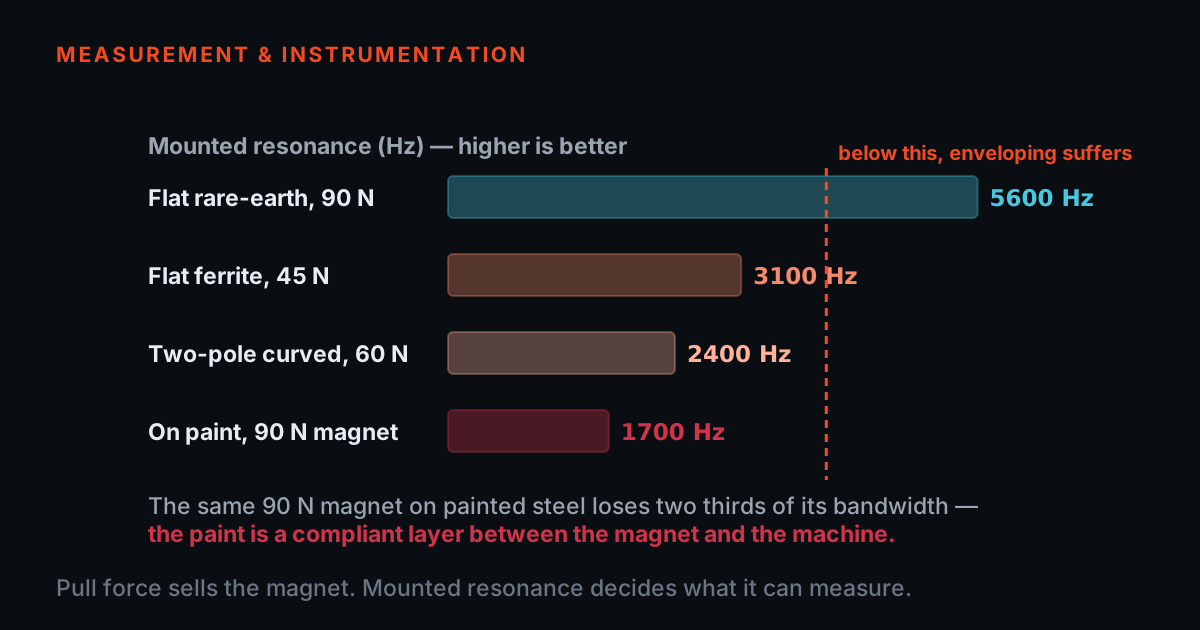
A magnet is not an accessory — it is the last spring between the machine and your accelerometer. A buyer's guide to pull force, flat versus two-pole curved geometry, surface condition and the five tests to demand, with a live bench that shows a flat magnet on a pipe collapsing your usable band.
 Interactive
What Makes a Good DAQ: Dynamic Range, Noise Floor, and How to Test One
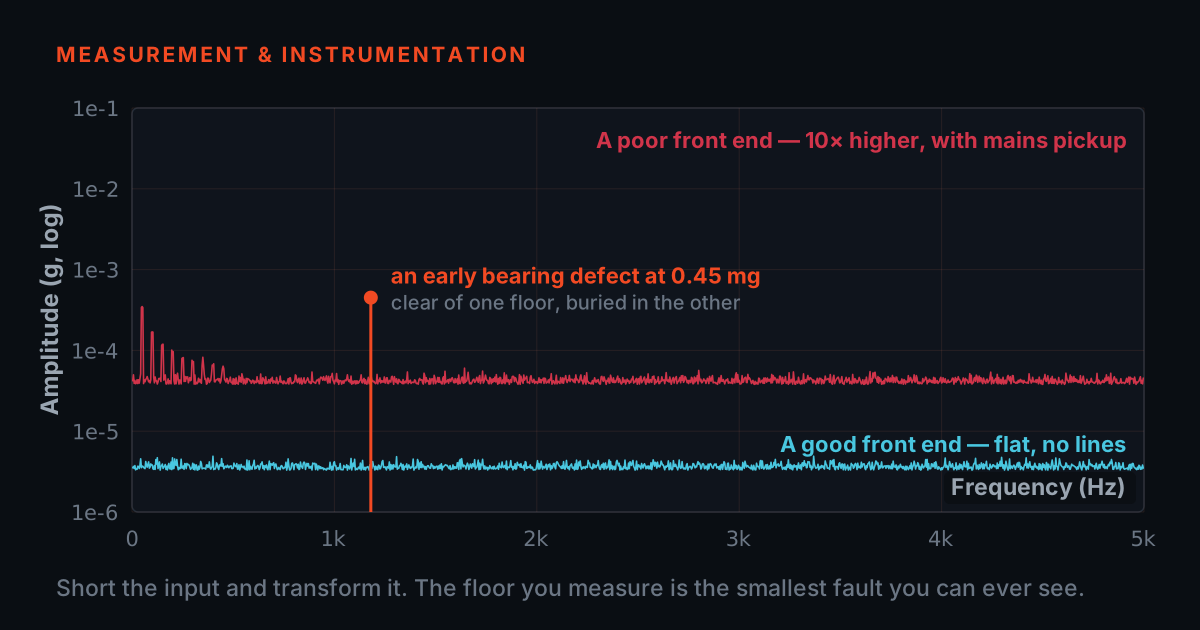
Two DAQ units both say 24-bit. One shows the bearing defect three months before failure; the other buries it in its own noise. Drive a live DAQ bench that quantises, clips, aliases and adds noise to a real machine signal, then take away the bench tests you should demand before you buy.
 Interactive
Acceleration, Velocity, Displacement: Same Motion, Three Answers — and the Traps Between Them
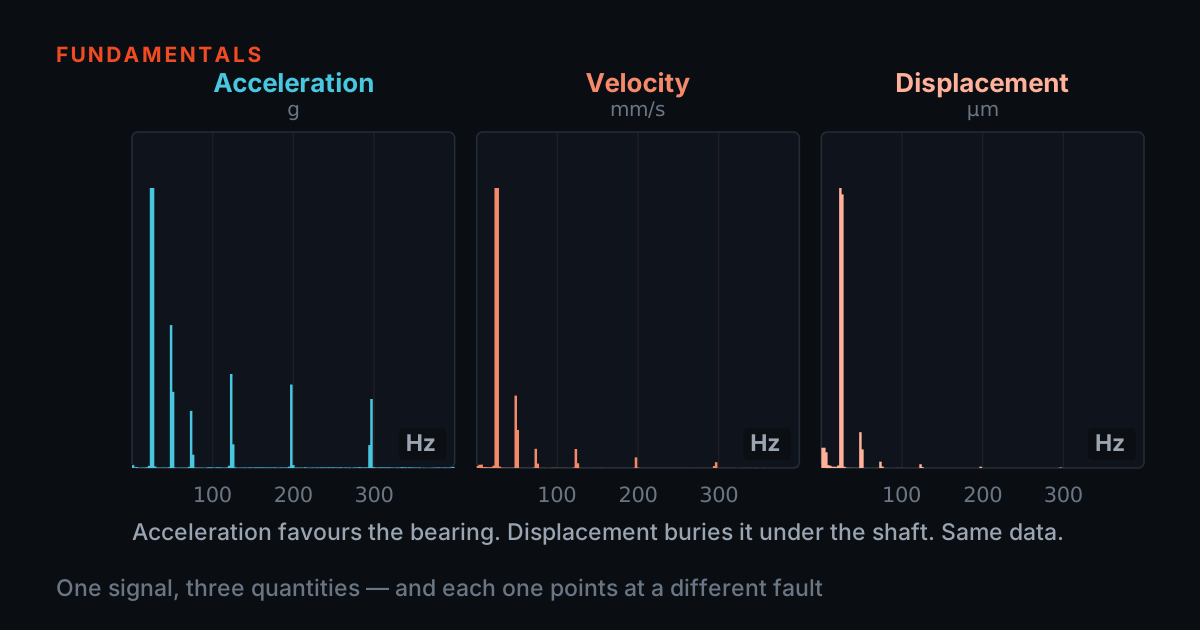
Two analysts measure the same bearing and report numbers that look incompatible — 0.02 g, 3 mm/s, 500 µm. All three can describe one motion, because each integration divides by frequency and tilts the whole spectrum. Here is the ω-arithmetic, the ski-slope trap that manufactures false millimetres, and how to integrate without lying.
 Interactive
When the Speed Will Not Sit Still: Smeared Spectra and Order Tracking
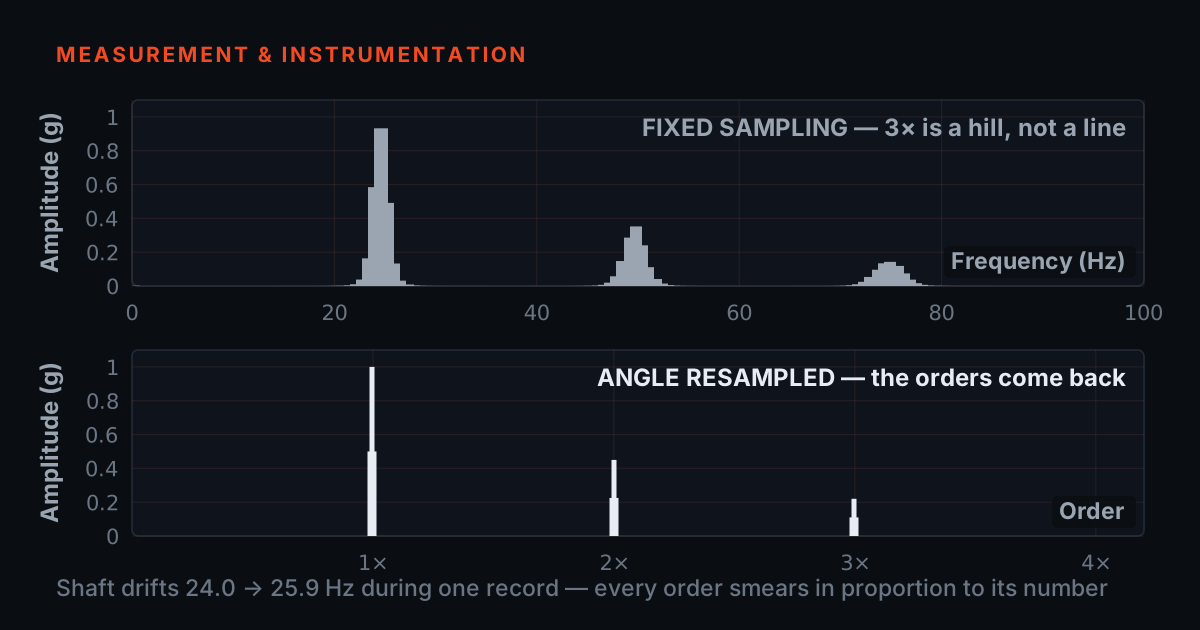
On a VFD-driven machine a perfectly good analyser can produce a useless spectrum: shaft speed drifts during the average, every shaft-related peak walks across bins, and the 10th order smears ten times as badly as the 1st. Order tracking — resampling the signal against shaft angle using a tacho pulse — collapses the smear back into sharp lines. A hard-concepts walk through why, with a live rig: dial in speed wobble, pile on averages, and watch the Hz spectrum die while the order spectrum holds.
 Interactive
The Magnet That Deleted a Bearing Fault
How you attach the sensor decides which frequencies you are allowed to see. A mini explainer plus a live simulator: pick stud, adhesive, magnet or probe, drag a fault frequency, and watch an early bearing tone vanish.
 Interactive
Sample Rate, Fmax and the Anti-Alias Filter: Getting the Front End Right
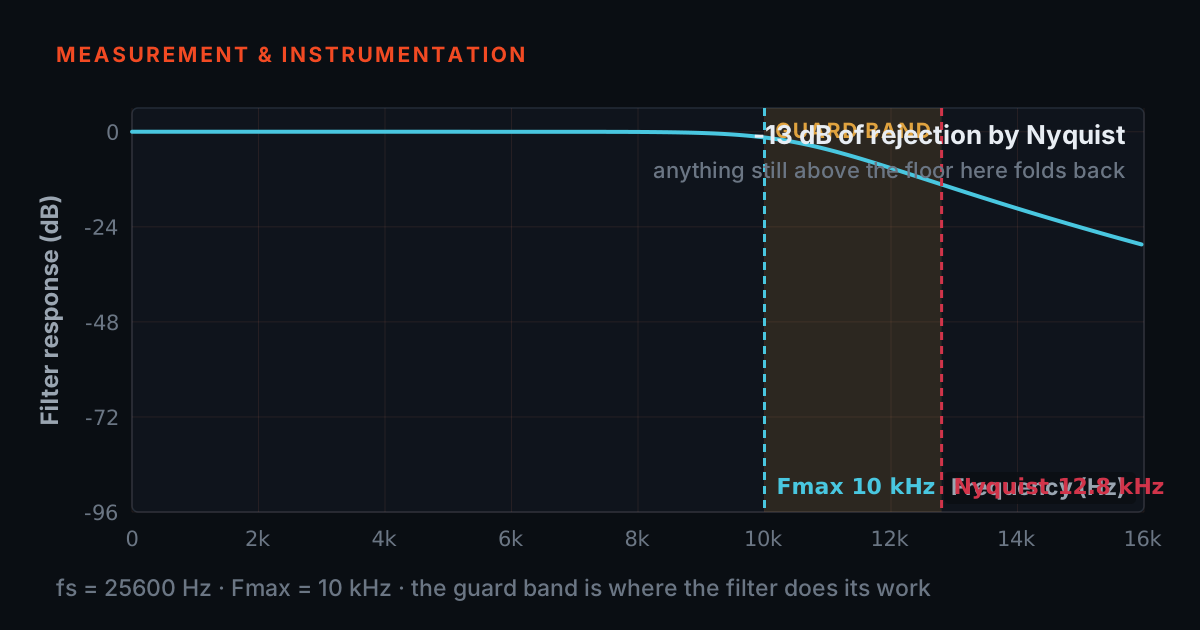
An alias is indistinguishable from a real fault once it is in the file. A visual walk through sampling, folding, Fmax, lines and the anti-alias filter — and how to pick a DAQ channel that cannot lie to you.
Pass or Fail in Seconds: How End-of-Line Noise and Vibration Testing Works
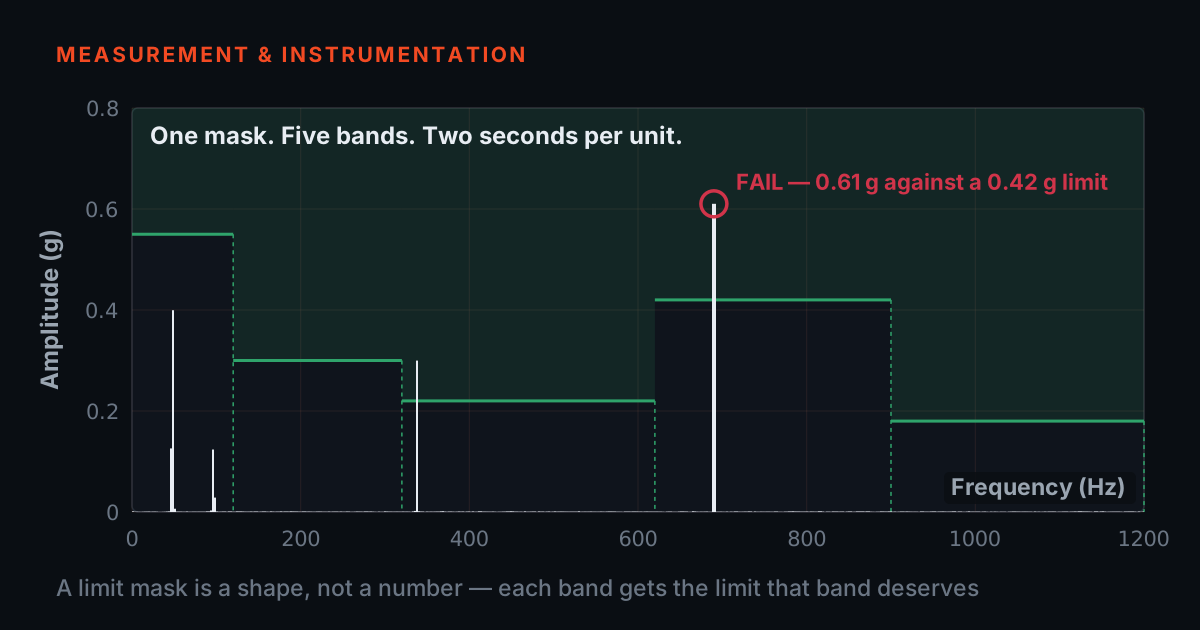
How a production line turns a skilled inspector's ear into a repeatable, auditable spectral limit test: why one overall number is too blunt, how band masks judge each unit, and why the limit itself is an economic decision.
 Interactive
What Makes a Vibration Reading Trustworthy
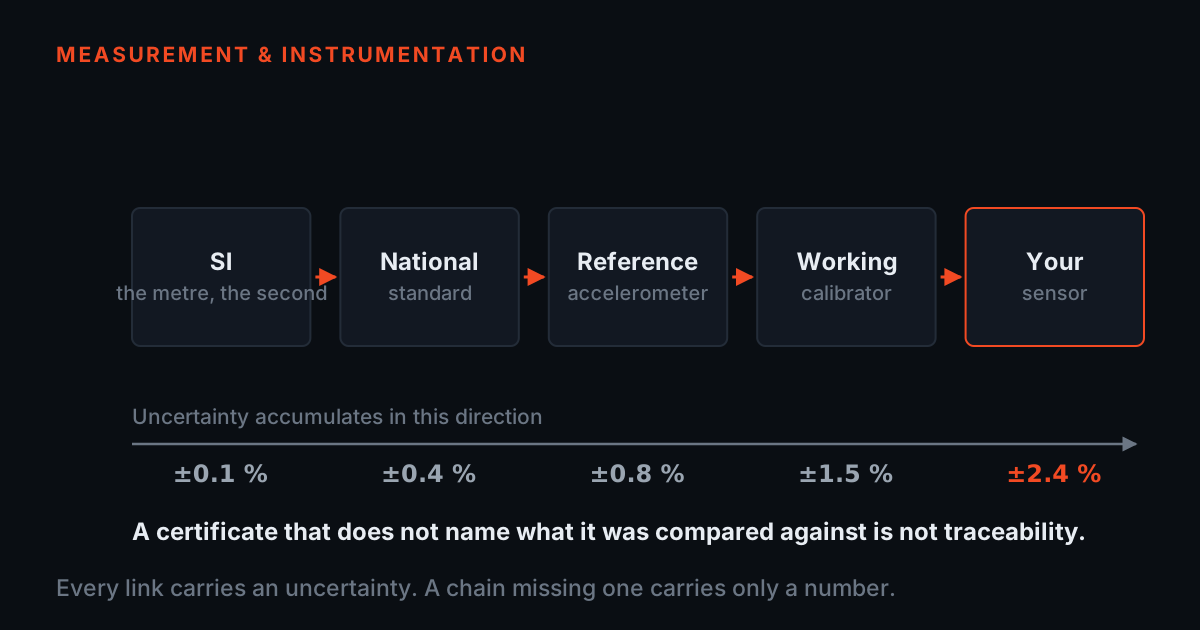
4.2 mm/s is not a fact — it is a voltage divided by an assumed sensitivity. A short visual tour of sensitivity, drift, damage, and what back-to-back calibration against a reference actually proves.
 Interactive
What a Signal Conditioner Actually Does — and When You Genuinely Need One
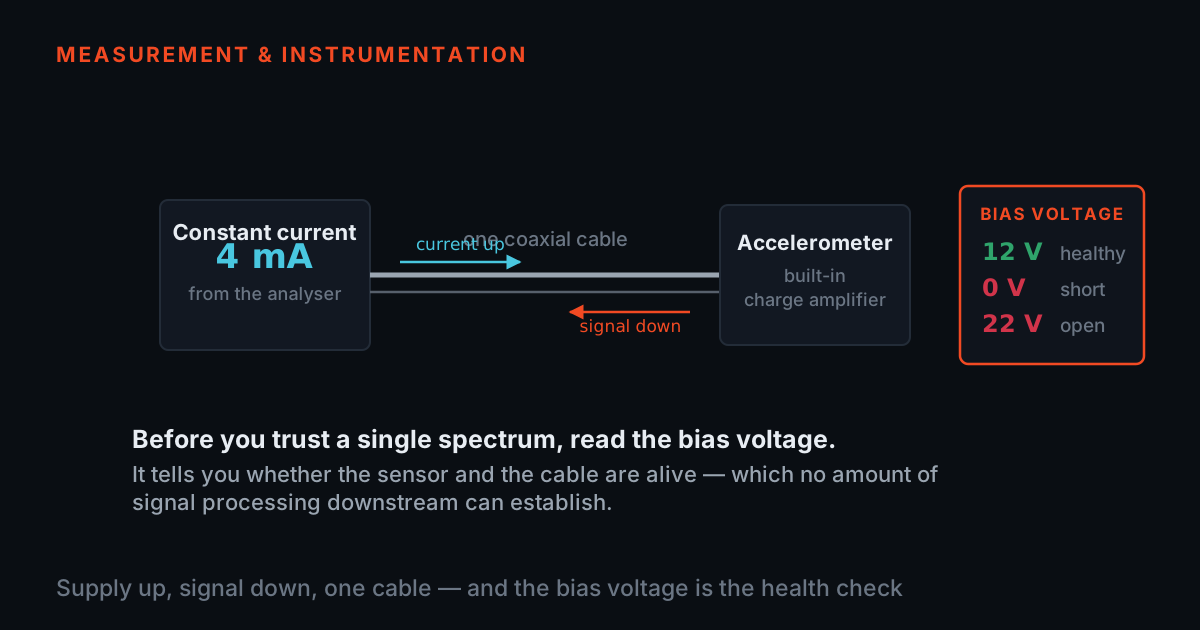
An IEPE accelerometer is not a passive sensor — it contains an amplifier that has to be fed a constant current before it will produce anything at all. Understanding that one fact explains constant-current supplies, bias voltage, cable-length limits, and most of the field faults that get blamed on a 'dead sensor'.
Measuring Sound Absorption in an Impedance Tube — and Why Your Number Disagrees With the Datasheet
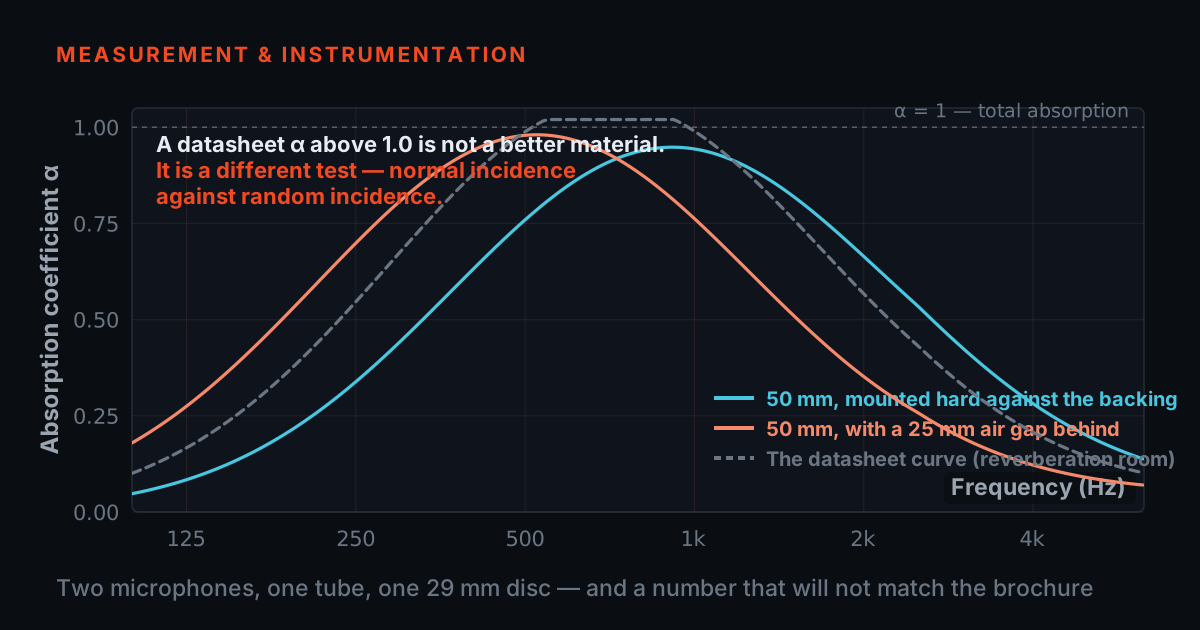
The two-microphone transfer-function method (ISO 10534-2) measures a material's normal-incidence absorption coefficient in a tube the size of a drainpipe. It is fast, repeatable and cheap — and it answers a narrower question than most people think, which is exactly why lab numbers and reverberation-room numbers disagree.
Shaker Testing: What the Stand Does, and Why a Good Shaker on a Bad Fixture Measures the Fixture
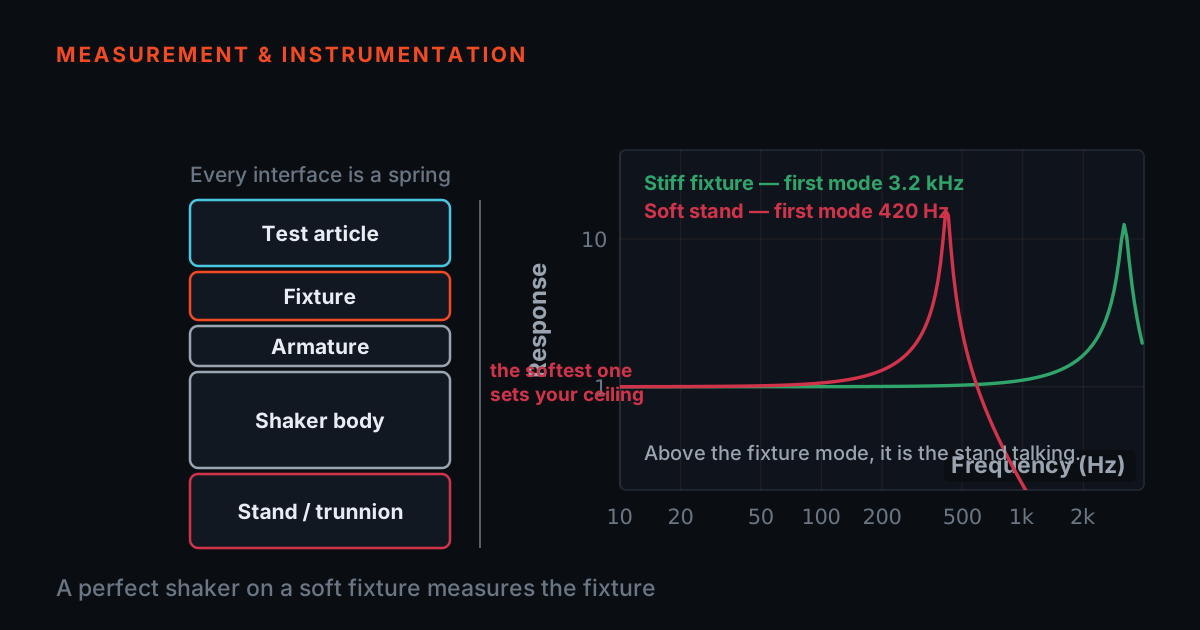
An electrodynamic shaker gives you controlled excitation — a known force, at a known frequency, repeatably. What decides whether the result means anything is the thing underneath it: the stand, the fixture and the boundary condition. Most disappointing shaker data is a fixture resonance wearing a costume.
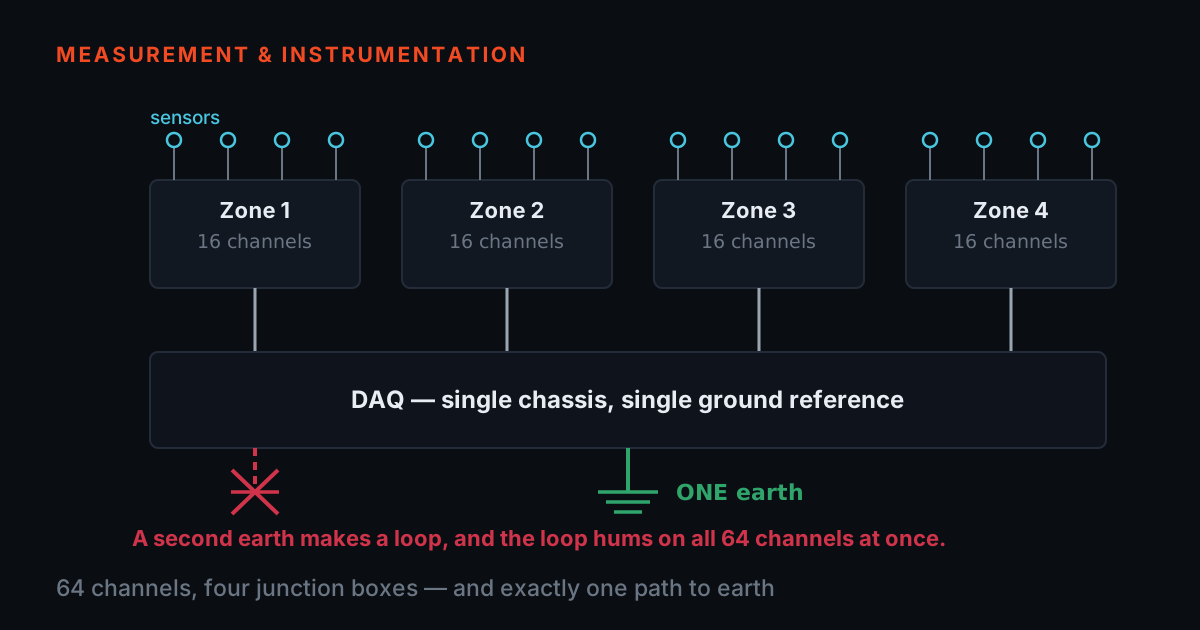
Wiring a 64-Channel Test: Junction Boxes, Ground Loops, and Channel Discipline
Below about eight channels, cabling is an afterthought. Above thirty it becomes the dominant risk in the test: a mains hum you cannot explain, a channel map nobody trusts, and a day lost to a connector that was never seated. The fixes are boring, cheap and almost always skipped.
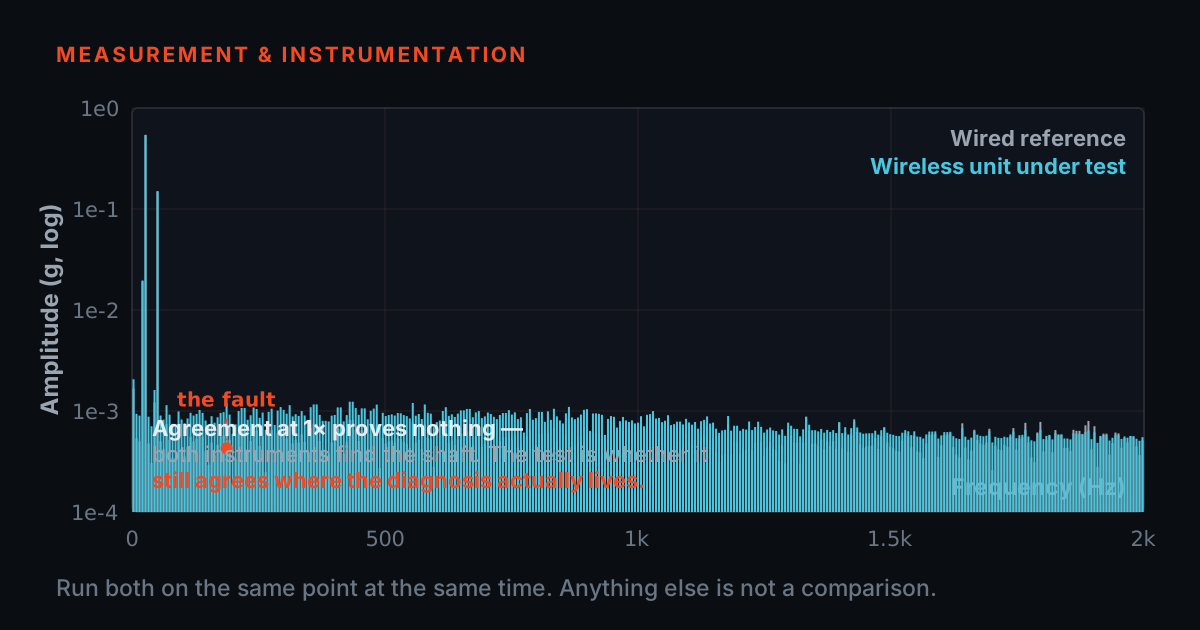
Validating a Wireless Vibration Sensor: What to Measure Before You Ship It
A wireless sensor has failure modes a wired one does not: a duty cycle, a battery, an internal clock and a radio between the measurement and the answer. Amplitude accuracy on a calibration shaker proves none of them. Here is the validation set that actually predicts field behaviour.

Wireless Sensor Validation Lab
A reference workflow for validating wireless accelerometers against wired sensors, calibration systems, and repeatable machinery faults.

Acoustic Impedance and Transmission Loss Measurement of Materials
How impedance tube testing helps labs measure absorption coefficient, acoustic impedance and transmission loss for foams, liners, panels and enclosure materials.
 Interactive
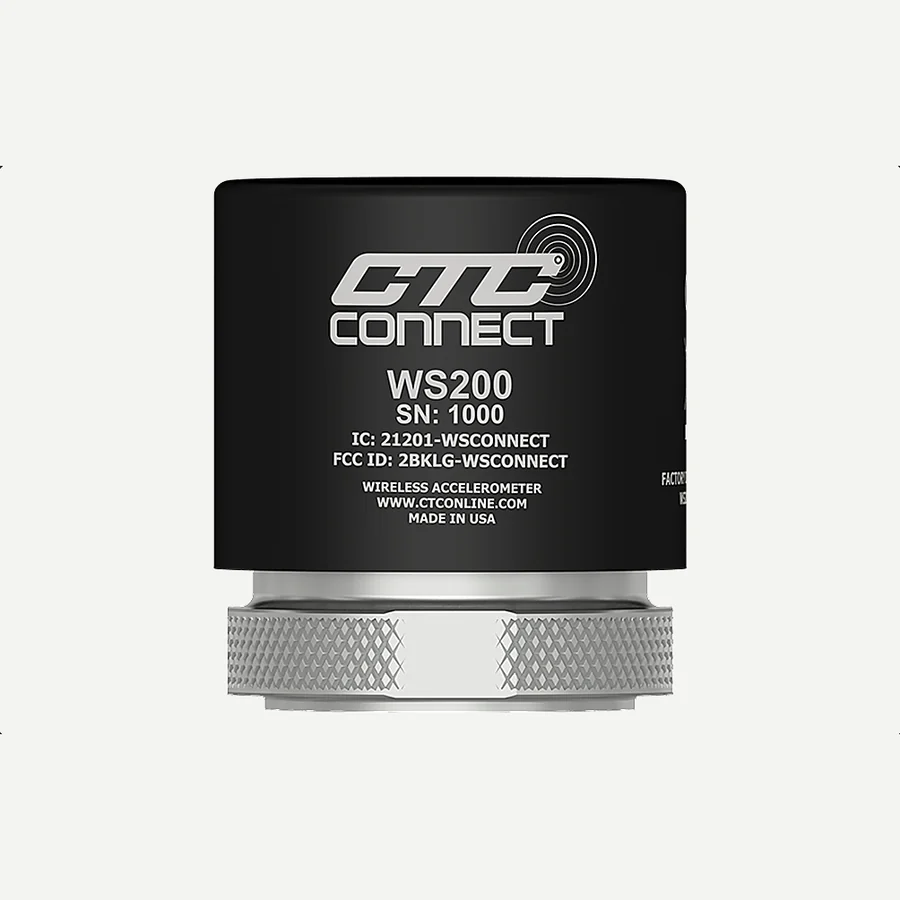
Overall or Waveform? What Your Wireless Sensor Can Actually Tell You
The most important spec on a wireless vibration sensor is not range or battery life — it is whether the sensor sends you a waveform or just a number. An overall-only sensor tells you that something changed; a dynamic sensor tells you what. This post does the arithmetic on why, and its simulator grows a synthetic bearing fault over 90 days so you can watch the envelope spectrum name the defect seven weeks before the overall trend crosses its alarm.
 Interactive
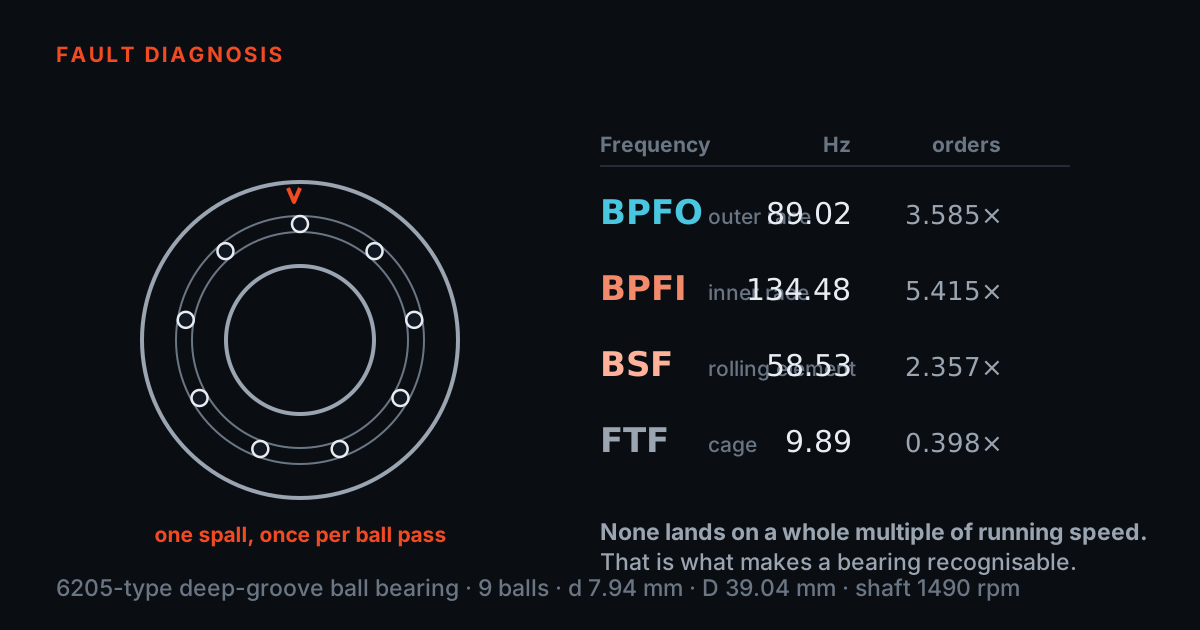
Work Out What Your Bearing Will Sound Like Before It Fails
Four numbers — Z, d, D and the contact angle — fix the exact rhythm every bearing surface will drum out when it spalls. Derive BPFO, BPFI, BSF and FTF from the standard formulae, see why none of them is a whole number, and dial in your own geometry on the live calculator.
 Interactive
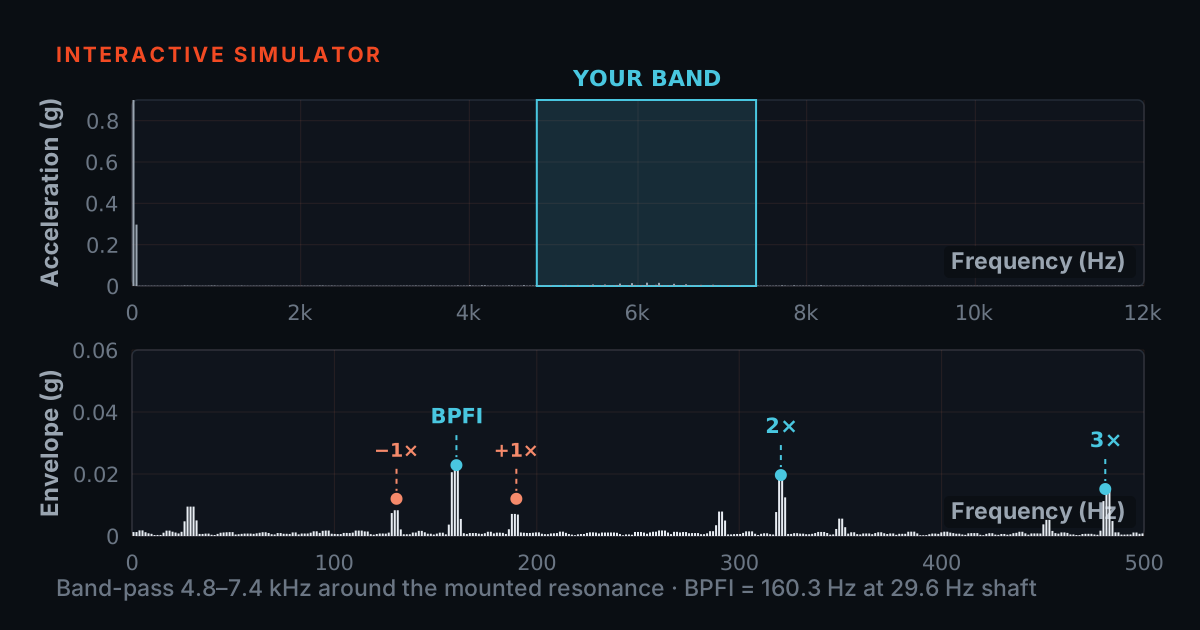
Tune the Band, Find the Bearing: An Interactive Envelope Demodulation Simulator
Envelope analysis is a tuning job: park a band-pass window on the bearing's ring frequency and the defect comb appears; slide it off and the comb dies. This simulator computes the whole chain live — synthesised impacts, a real band-pass filter, a real envelope spectrum — so you can feel it, like tuning a radio.
 Interactive
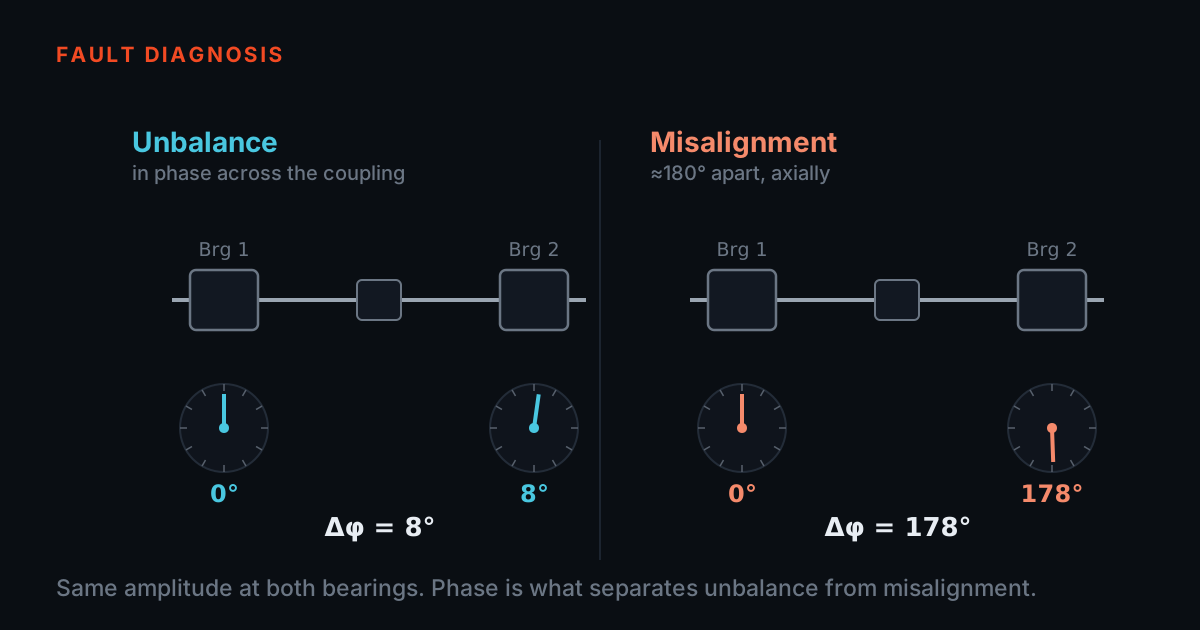
Phase: The Ruler Most People Never Pick Up
Amplitude says how much, frequency says how often — phase says how the machine is actually moving. A mini explainer plus a live simulator: pick a fault, toggle the measurement direction, and read the phase pattern that separates faults the spectrum cannot.
 Interactive
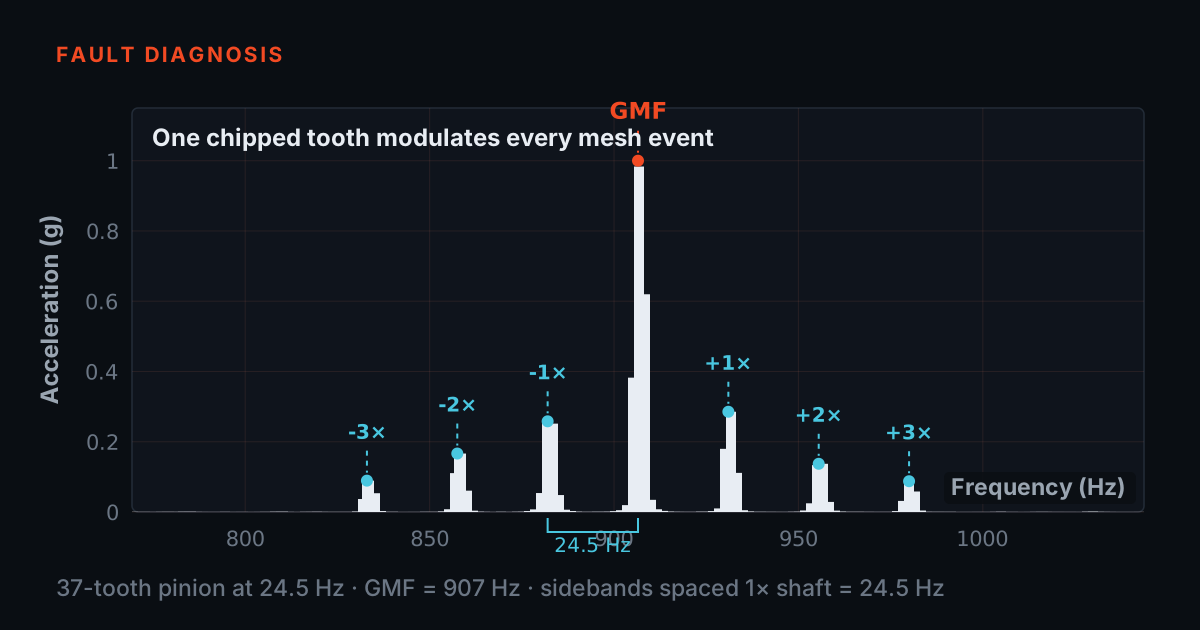
One Chipped Tooth, Once per Revolution: Reading Gear Mesh and Its Sidebands
The mesh tone is a gearbox's normal singing voice — its height alone proves little. A chipped tooth modulates that tone once per revolution, growing sidebands around the GMF, and their spacing names the guilty shaft. Includes a live spectrum explorer you can drive.
 Interactive
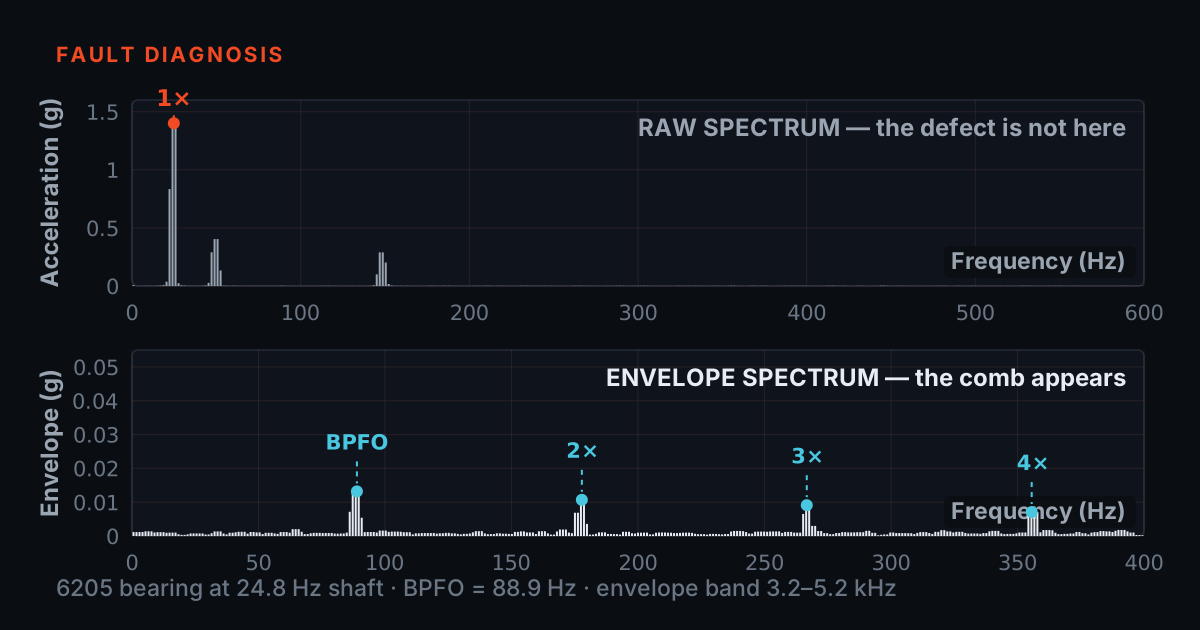
Why a Failing Bearing Hides in the Noise — and How Envelope Demodulation Finds It
An early bearing defect is a tiny, perfectly repetitive impact buried under shaft and blade energy. Enveloping — band-pass around the resonance, then demodulate — makes its comb visible long before the machine gets loud.
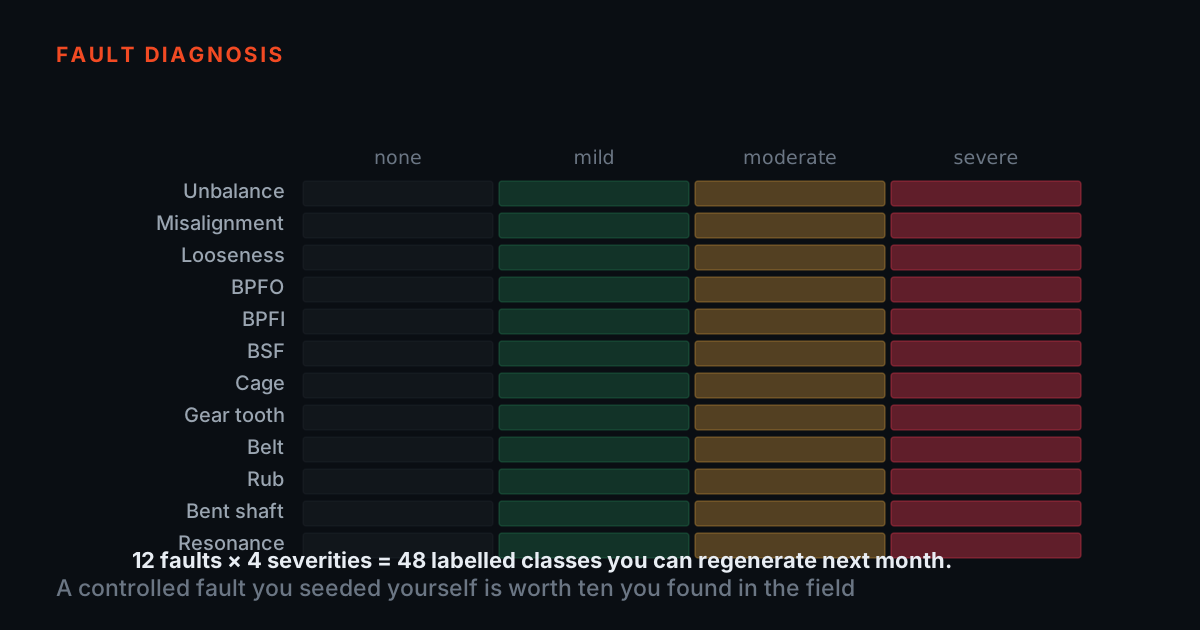
Building a Controlled Machinery Fault Library with TMFSS
A visual mini-explainer: how a lab reproduces unbalance, misalignment, looseness, bearing defects and gear faults on demand, and why a label you set before capture beats a label you guess afterwards.
 Interactive
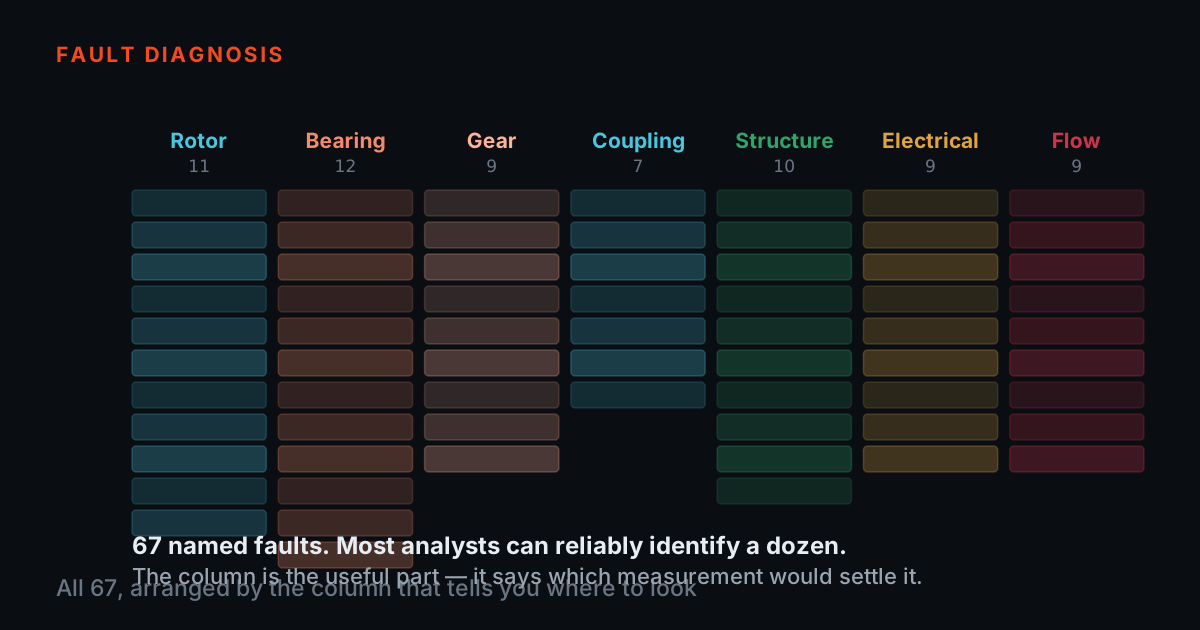
The Periodic Table of Machinery Faults — All 67, Column by Column
Sort every vibration fault by what its spectrum looks like and you get a recognition index a beginner can enter knowing nothing else. This walks all six columns and names all 67 faults — then covers what the arrangement cannot do: decide, rank your next measurement, or notice that your record was never readable.
 Interactive
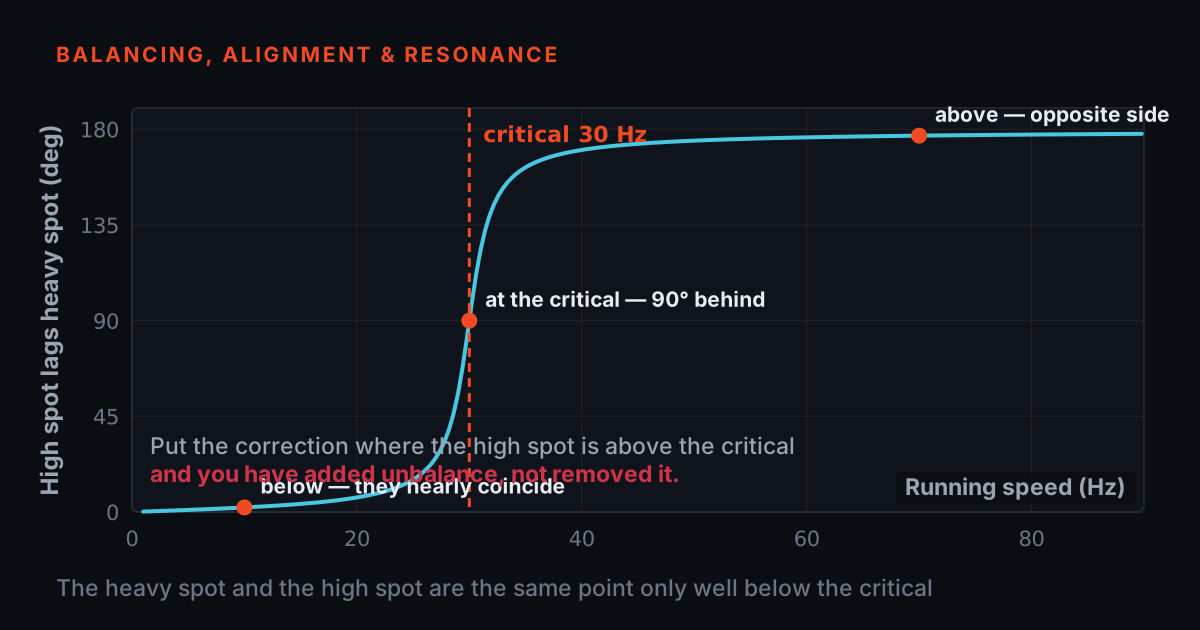
Heavy Spot vs High Spot: Why the Vibration Does Not Point Where the Weight Is
The heavy spot is where the unbalance mass sits; the high spot is where the orbit peaks — what the sensor sees. Between them is a phase lag that swings from 0° to 180° as speed crosses the critical. Understanding that lag explains rotor inversion, why a balance job can look wrong at another speed, and why the correction angle is measured, never assumed.
 Interactive
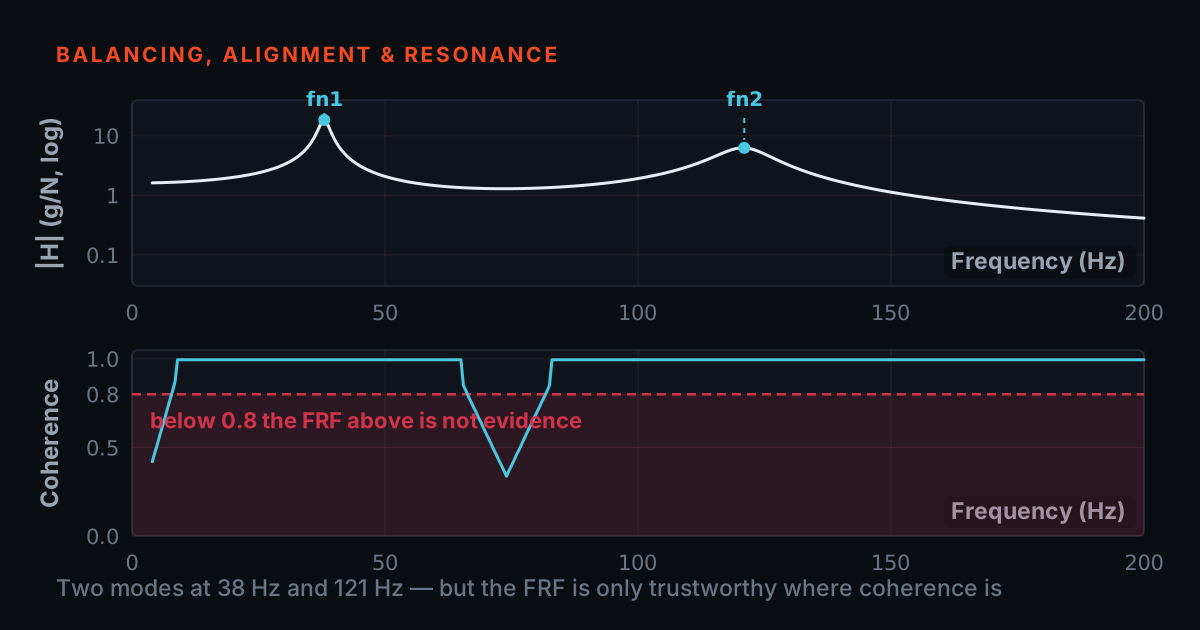
Coherence: the Number That Tells You Your FRF Is Lying
Every FRF comes with a built-in lie detector, and most people never look at it. What coherence actually measures, why it dips at antiresonances but must not dip at your peaks, how H1 and H2 fail in opposite places, and why a single average always reads a perfect — and perfectly meaningless — 1.0.
 Interactive
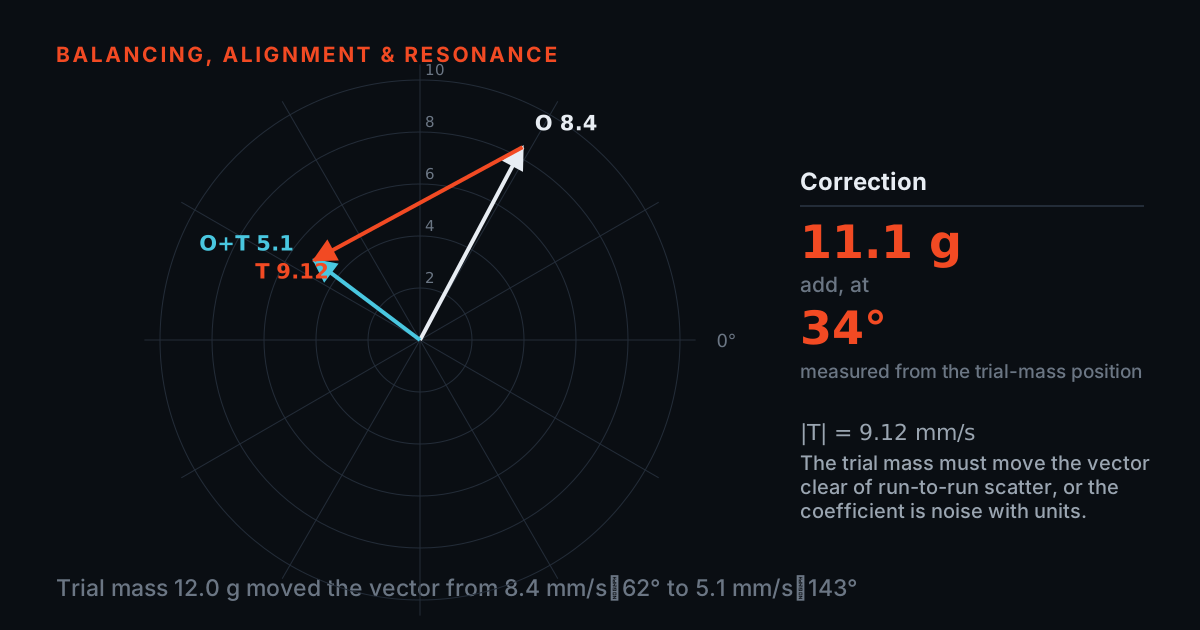
Solve a Single-Plane Balance Yourself: A Live Influence-Coefficient Solver
Enter a reference run, a trial weight and a trial run, then drag the weight around the rotor and watch the correction mass and angle update live. The arithmetic behind every field balance, running in your browser.
 Interactive
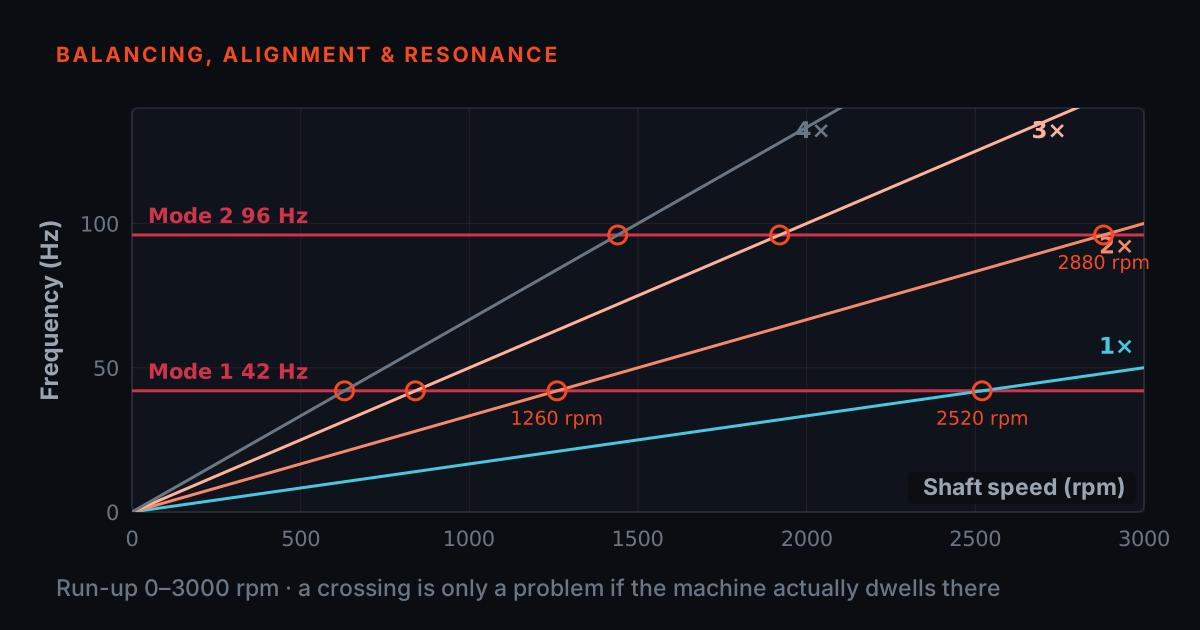
Run It Up Yourself: Drive a Machine Through Resonance on a Live Campbell Diagram
A hands-on companion to our resonance-or-forcing explainer. Drag the running speed, set one or two natural frequencies and a damping level, and watch forcing lines cross structure lines on a Campbell diagram while an honestly-computed response curve shows the shudder build and fall away.
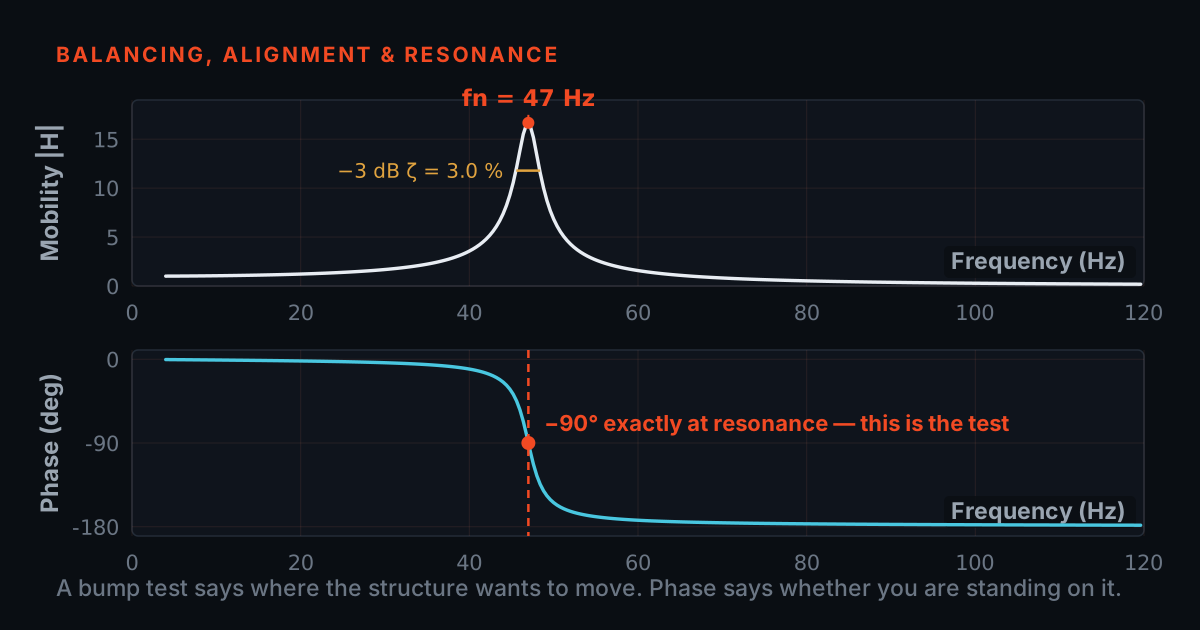 Interactive
Is It Resonance, or Is It the Force? How to Tell in an Afternoon
Why balancing a machine again and again never fixes a resonance, what a natural frequency actually is, and the two quick field tests — the bump test and the coast-down — that settle the question.
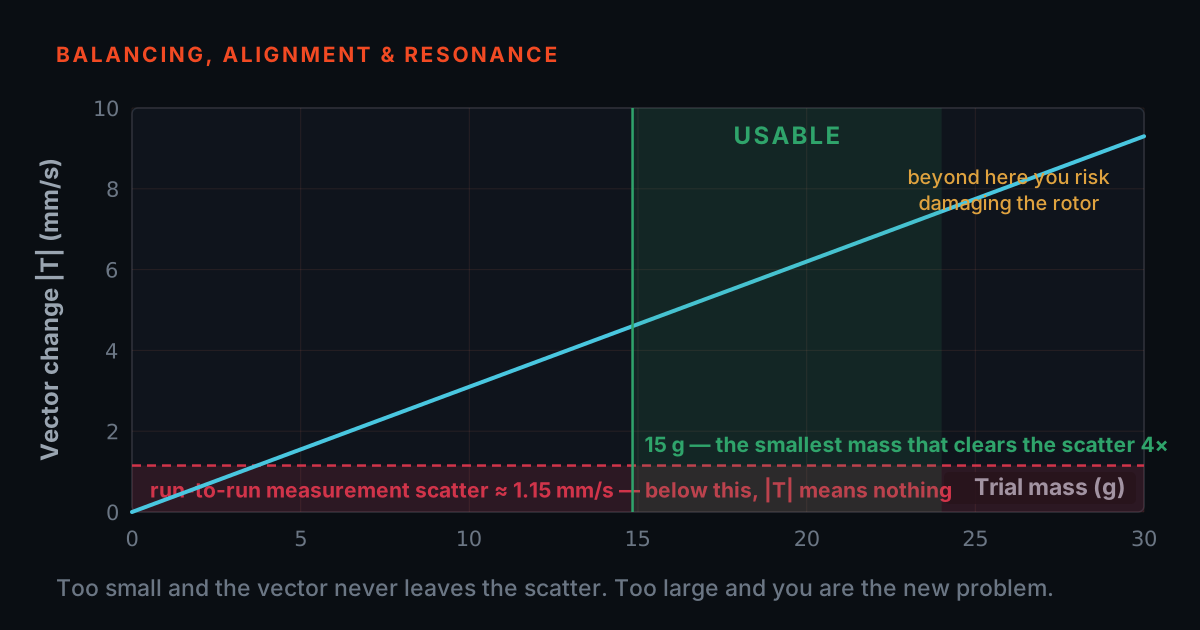 Interactive
Balancing a Rotor in Place: Trial Weights, Phase and the Influence-Coefficient Method
A visual walk through field balancing — reference run, trial run, correction, verification — why every run must be at the same speed, and what an ISO 21940 balance grade really commits you to.
 Interactive
Mode Shapes, Explained with a Skipping Rope
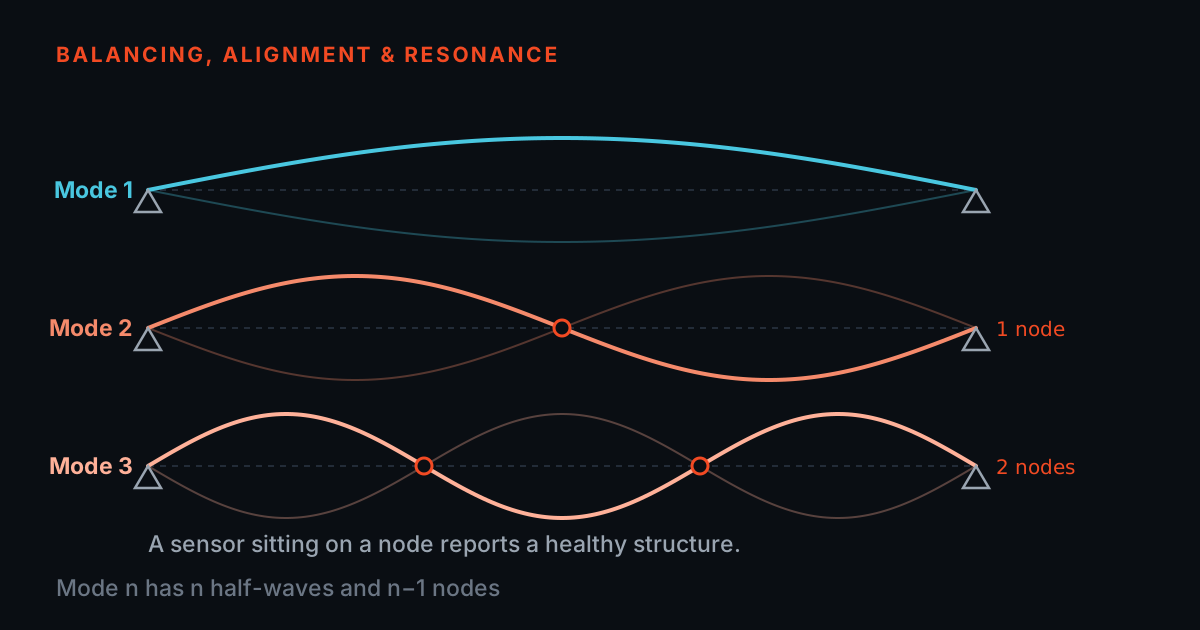
What a mode shape is, why one structure has several, when to reach for a hammer versus a shaker, and how to read an FRF — the short visual version for R&D teams chasing a ringing panel or bracket.
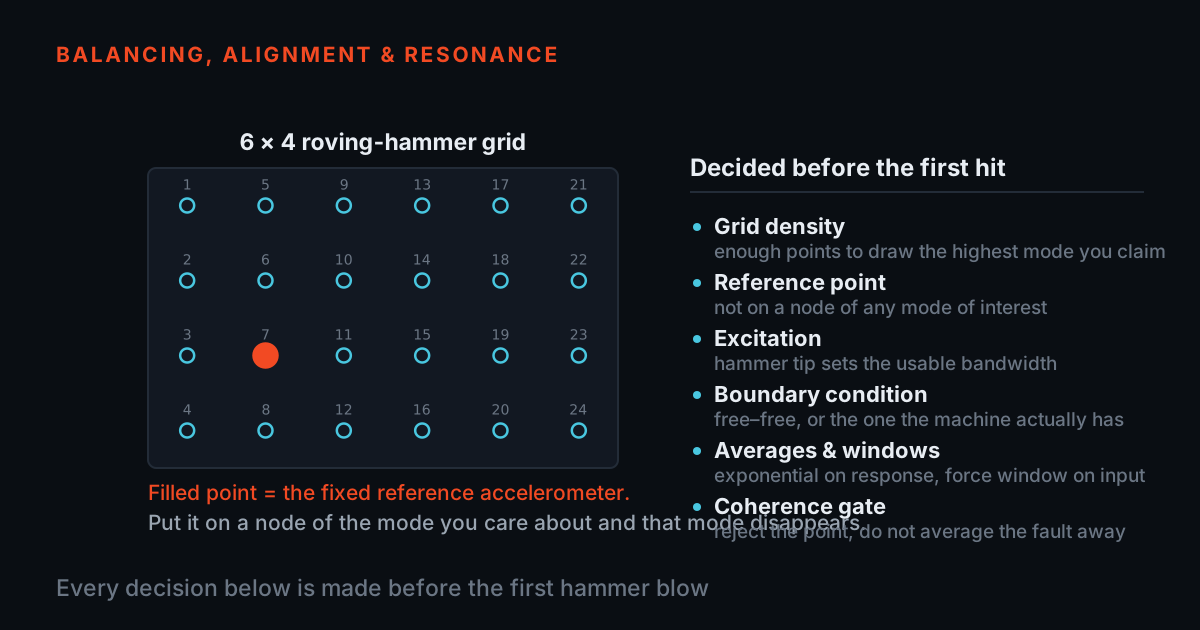
Planning a Modal Test: The Decisions You Make Before the First Hit
Where you put the reference, how you support the structure, and how many points you measure are decided before any data exists — and they set the ceiling on what the test can possibly tell you. No amount of curve-fitting recovers a mode you put a reference on the node of.
 Interactive
Getting Wireless Vibration Data Into Your Own Software
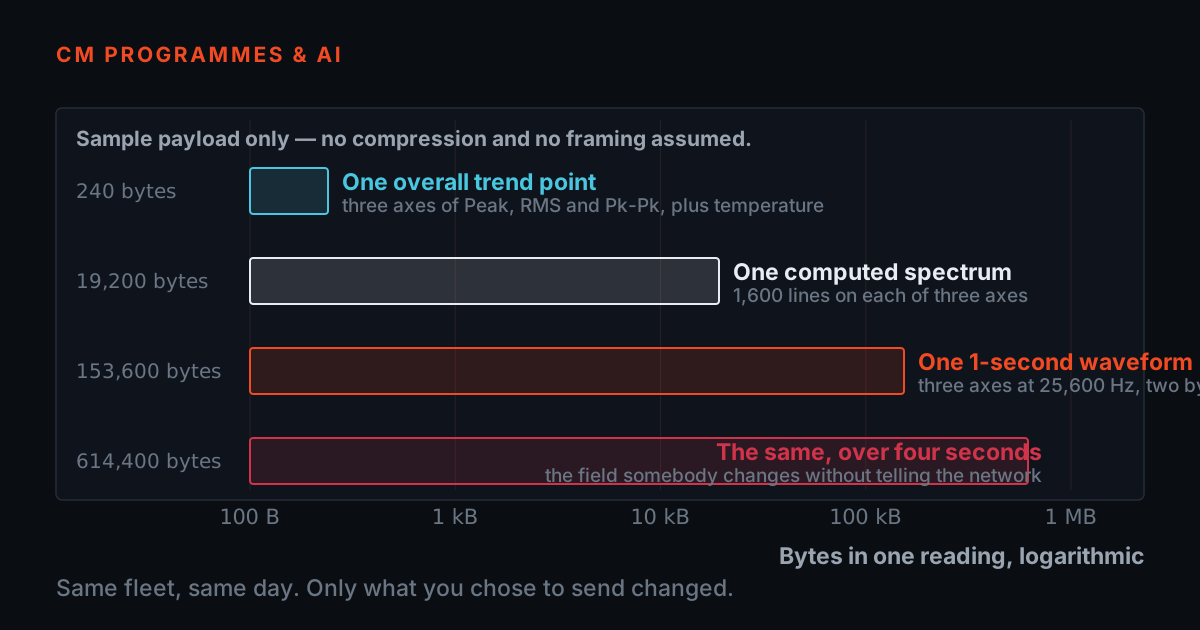
Your plant's vibration history does not have to live on somebody else's server behind a per-sensor monthly fee. Here is the architecture that keeps it on your own network, the topic and payload design that makes it usable, the fleet bandwidth arithmetic that kills naive designs — you can drive it yourself — and the one security rule no vendor writes down.
Interactive
Wired, Wireless, or a Walk: An Honest Decision Guide for Vibration Monitoring
Wireless vibration sensors are the fastest-growing way to instrument a plant — and the most oversold. This guide gives you the three questions that actually decide between a wired online system, a wireless sensor network, and a route with a portable analyser: the frequency you need, the cadence you need, and the cost per point. With a calculator you can drive, and a plain list of the jobs wireless cannot do.
 Interactive
Why the Cheapest Cable and Magnet Cost the Most
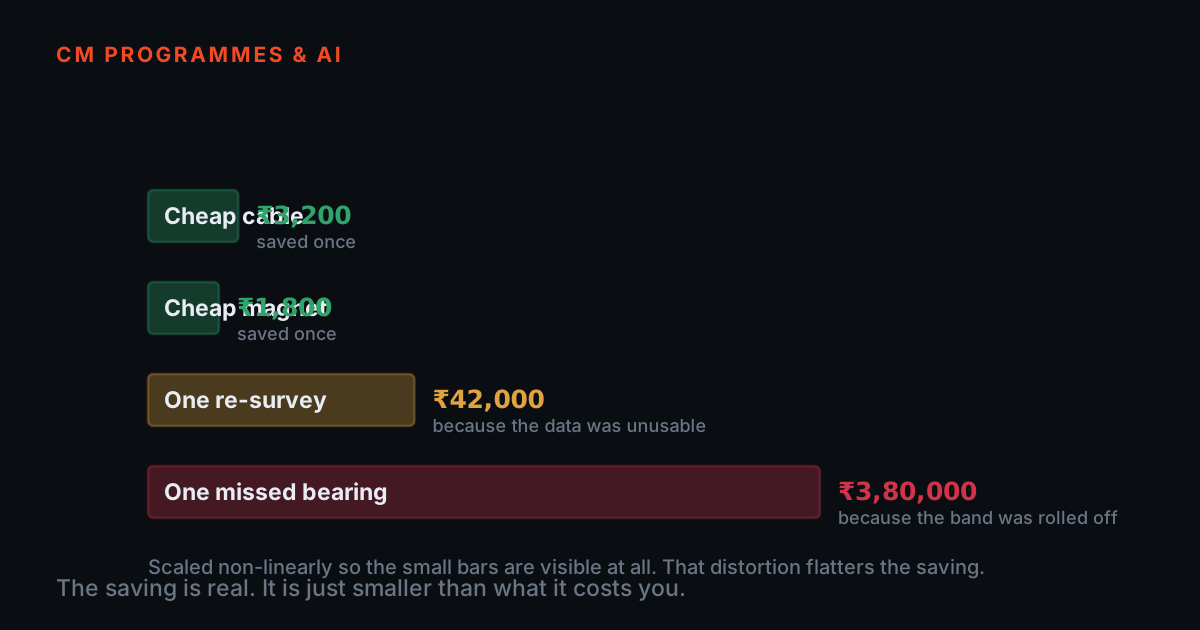
A plant will approve a serious analyser and then defeat it with an unspecified cable and an unknown magnet. This is the commercial case for buying the whole measurement chain to a specification — the three failure modes that cost real money, the questions that separate a measurement-grade accessory from a generic one, and an interactive model you can drive with your own numbers.
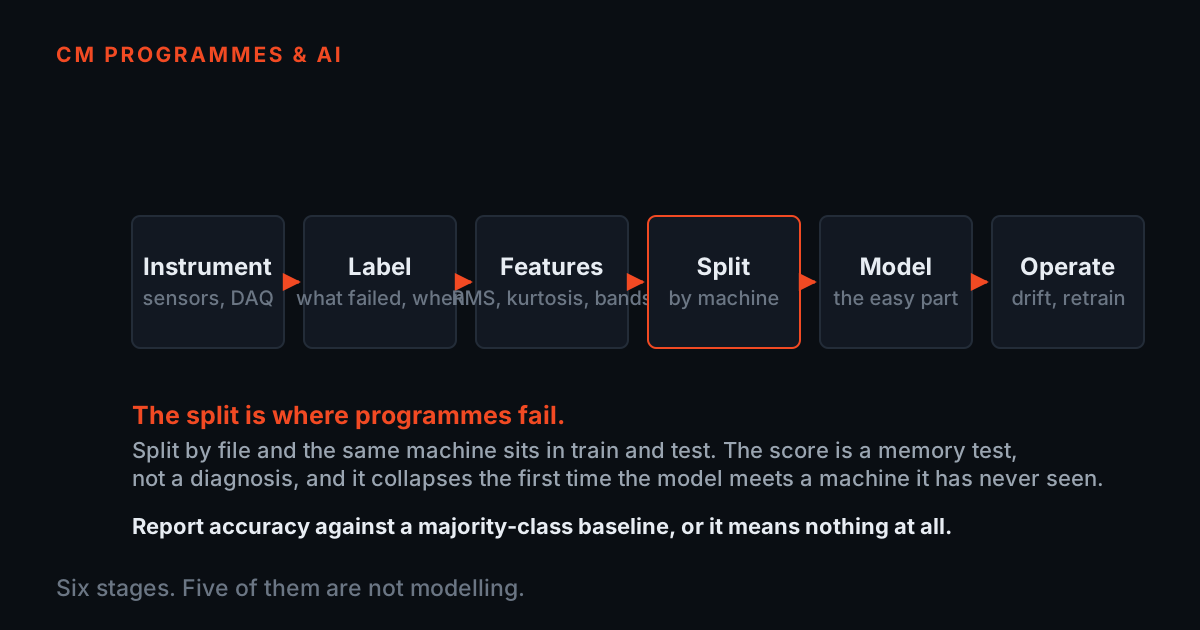
How an AI Condition-Monitoring System Is Actually Built
The end-to-end engineering of an AI condition-monitoring system, honestly: instrumentation that sets the ceiling, a baseline wide enough to trust, features you can audit, why real deployments are anomaly detection rather than fault classification, thresholds and persistence rules, and the drift and re-baselining that fill the years afterwards.
 Interactive
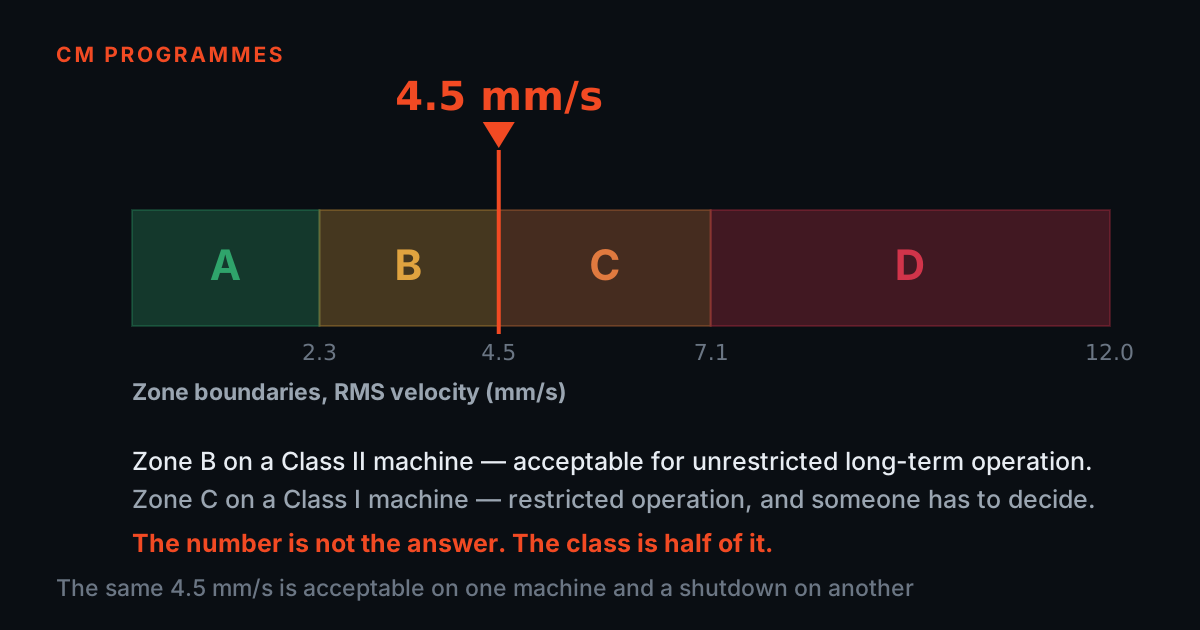
How Bad Is 4.5 mm/s? Reading Vibration Severity Without Guessing
4.5 mm/s RMS is a red flag on a small motor and mid-band normal on a large turbine set. An interactive checker shows how ISO 20816-style severity zones shift with machine class and mounting — and why your own trend beats any table.
 Interactive
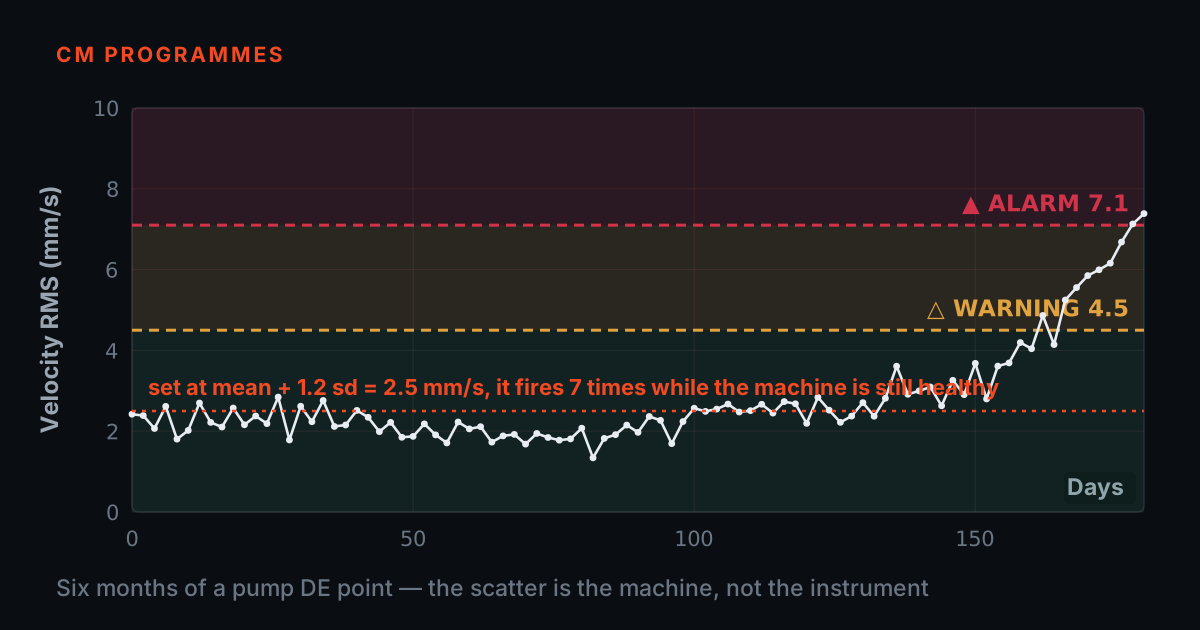
Set the Alarm Too Tight and Nobody Listens: Choosing Thresholds You Can Live With
Every alert and alarm line is a bet between wasted trips and lost warning time — there is no perfect threshold, only one your team can live with. A mini explainer plus a live trainer: drag the lines, count the false alarms, watch the warning window shrink, and see what a simple consecutive-readings rule buys.
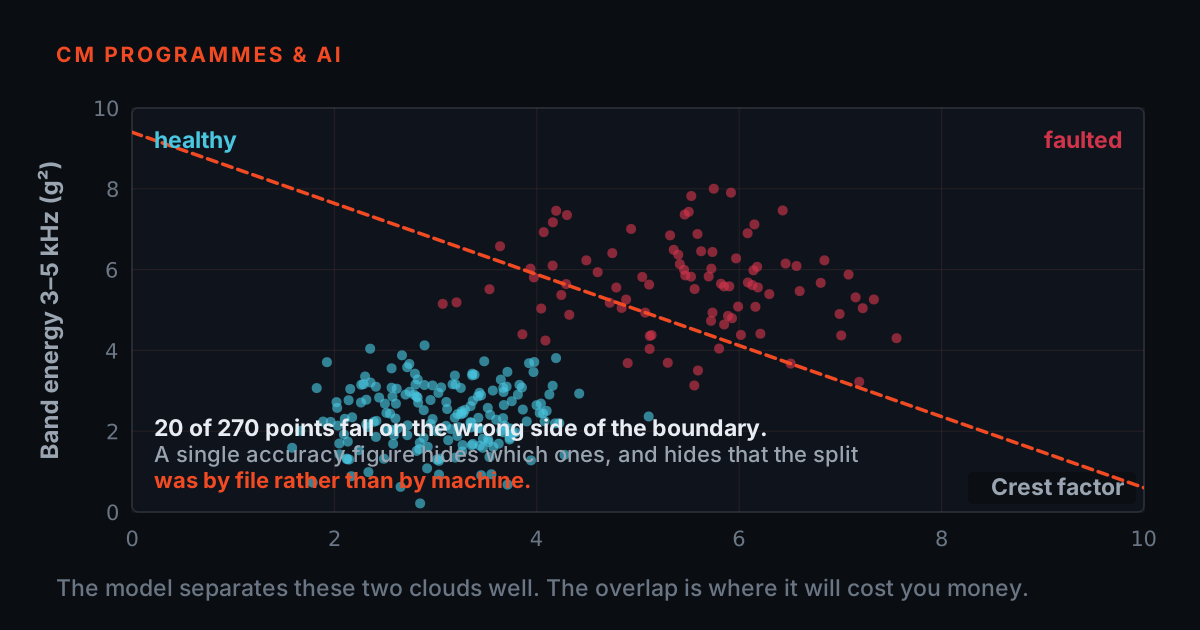
What AI Can and Cannot Tell You About a Machine
Anomaly detection is genuinely useful: it says 'this is not normal' earlier than a human round can. But it does not name the fault, and it inherits every bias in the baseline it learned. An honest look at scores, thresholds, false alarms, and why labelled data matters.
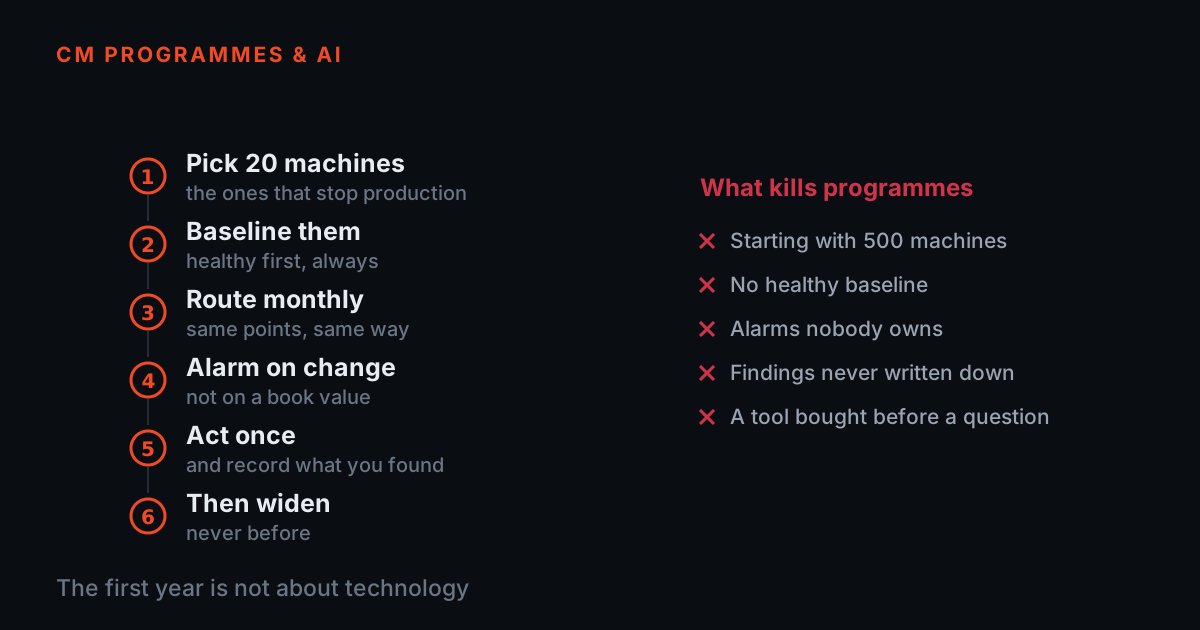
Starting a Condition-Monitoring Programme Without Buying Everything at Once
The practical first 90 days: pick the machines that actually matter, define a repeatable route, take a baseline while they are healthy — and only then argue about alarm limits.
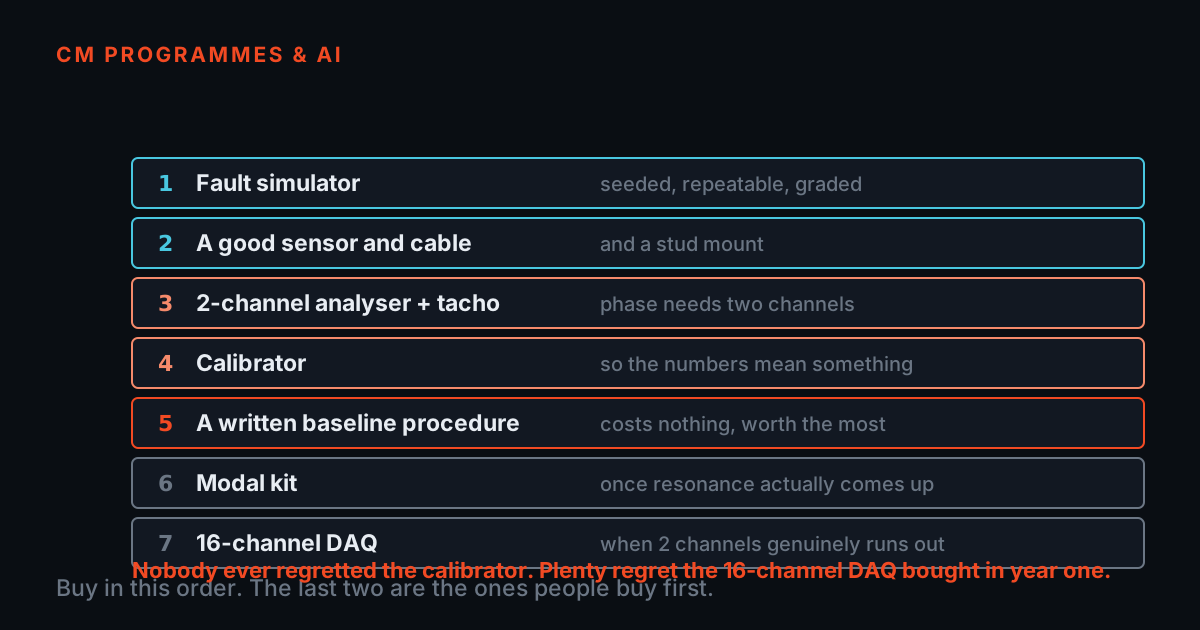
Building a Vibration Training Lab: What to Buy First, and What Nobody Uses
The equipment that makes a vibration course work is not the equipment that photographs well. A fault simulator earns its cost in the first cohort; a second analyser and a wall of sensors usually do not. Here is the order we would buy in, and the honest reason for each step.
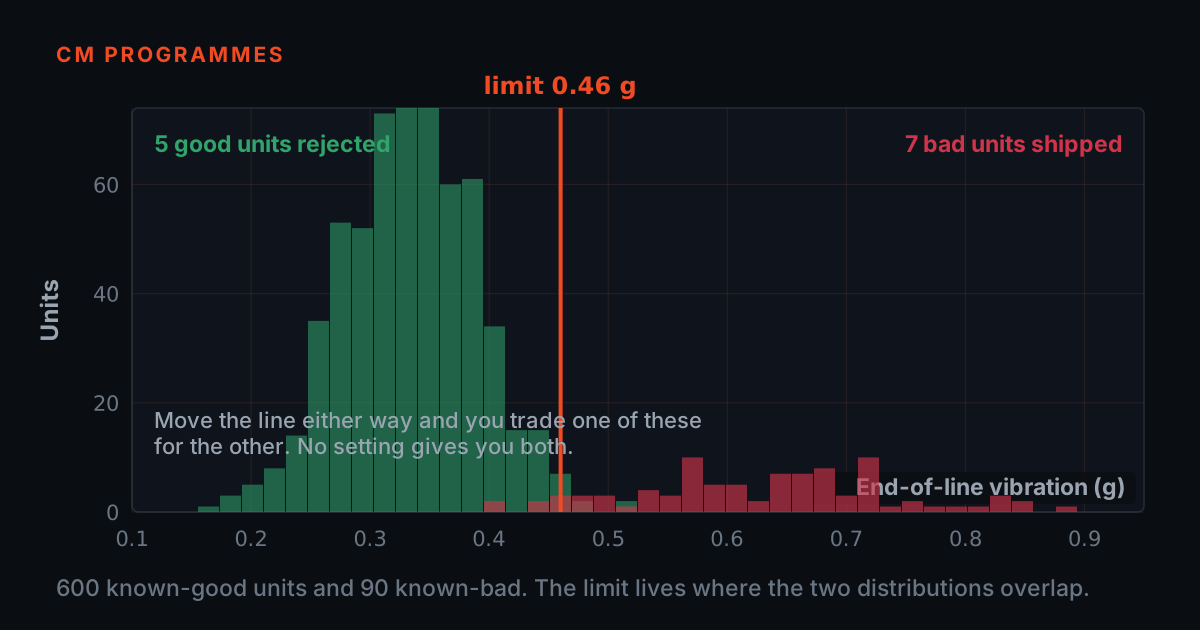
Setting Pass/Fail Limits on an End-of-Line Test Without Guessing
The hard part of end-of-line testing is not measuring the unit — it is deciding where the line goes. Set it from a handful of good units and you will fail good product for a year. Set it from the loudest thing that ever shipped and you will pass the defect you built the station to catch.
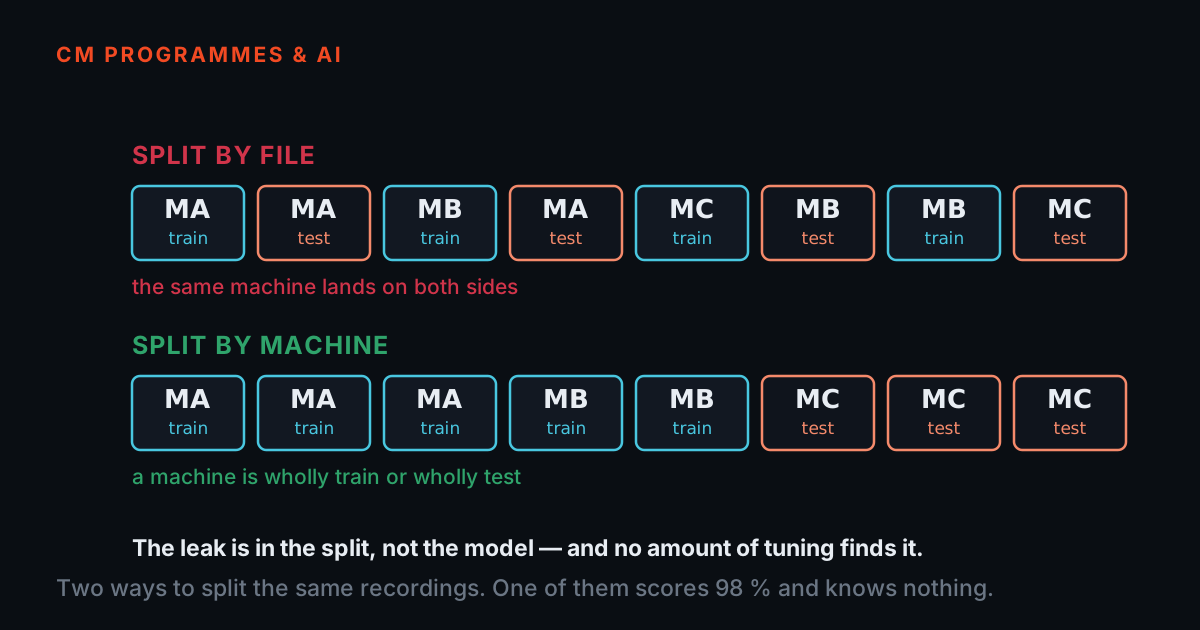
Building a Condition-Monitoring Dataset That Does Not Lie to Your Model
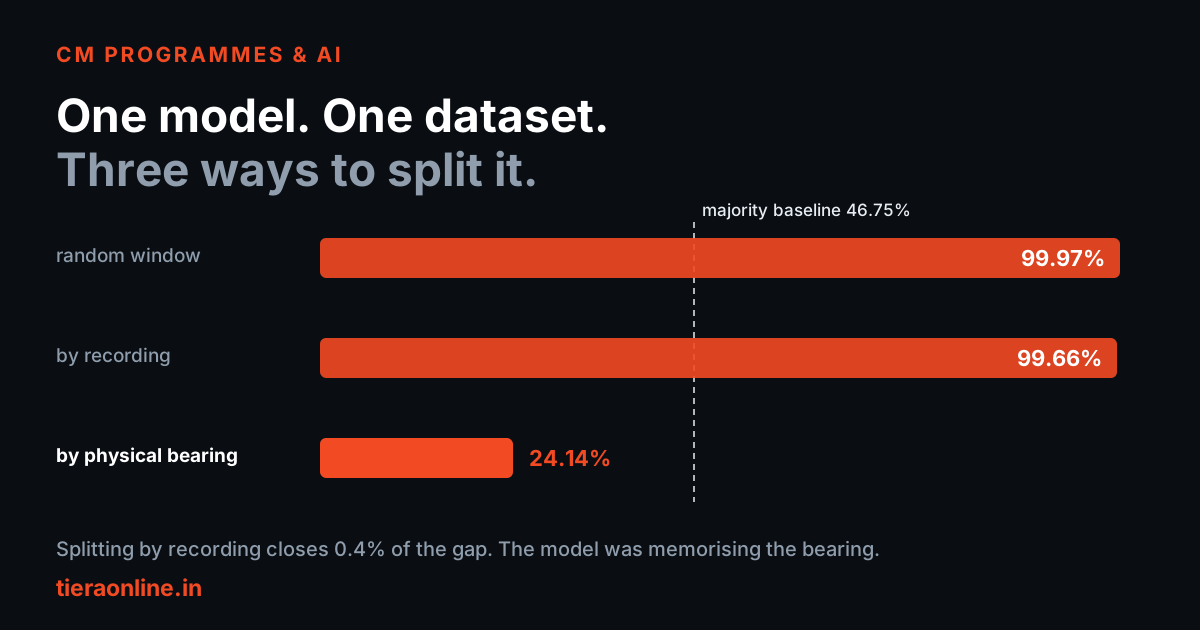
Most published 99% accuracies in machinery diagnostics are leakage. Split segments from the same recording across train and test and the model memorises the machine, not the fault — and the number it reports is a measurement of your split, not of your algorithm.
 Interactive
The Machinery Data You Are Allowed to Train On
Twenty public machinery datasets, read licence by licence. The most-cited bearing dataset in machine learning carries no licence at all; the best one for current-signature work forbids commercial use; one has gone offline entirely. You cannot buy machinery fault data — but your monitoring vendor's contract may already own yours, fault labels included. Then the harder question: on real CWRU data, the same model scores 99.97% or 24.14% depending only on how you split it.
 Interactive
Designing a Vibration Route: Where to Measure, How Often, and What to Stop Collecting
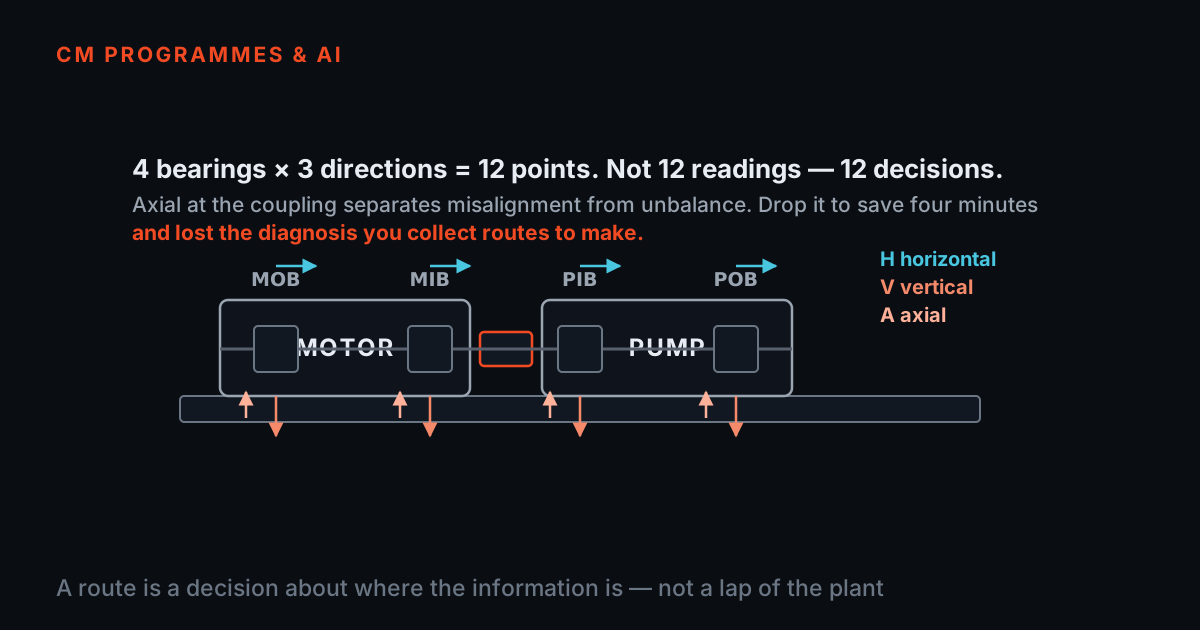
A route that takes four hours and gets walked is worth more than one that takes two days and gets skipped. Most struggling programmes are not short of technology — they are carrying points nobody reads, at intervals nobody chose, on machines nobody ranked.

ML / AI Algorithm Development for Predictive Maintenance
How controlled machinery faults, synchronized vibration capture, and analyst-labelled features create useful training data for predictive-maintenance models.
Machine Condition Monitoring Lab for Research Universities
How universities can build a practical vibration lab for condition monitoring, diagnostics, modal testing, and student research.