Published · Updated
Designing a Vibration Route: Where to Measure, How Often, and What to Stop Collecting
A route that takes four hours and gets walked is worth more than one that takes two days and gets skipped. Most struggling programmes are not short of technology — they are carrying points nobody reads, at intervals nobody chose, on machines nobody ranked.
Rank the machines before you touch the route
- Rank by consequence of failure, not by size: a small unspared transfer pump that stops the line outranks a large spared unit you can switch over in ten minutes.
- The ranking sets the depth of monitoring, and the tiers are supposed to look very different — a full point set, a standard route, or a walk-round with a meter.
- A programme that treats every machine the same spends analyst hours uniformly across assets whose value is anything but uniform.
The first question is not where to put the sensor. It is which machines deserve one at all, and the honest answer is that most plants monitor too many machines too shallowly rather than too few too well.
Rank by consequence of failure, not by size or by how interesting the machine is. A small unspared transfer pump that stops the line is a higher priority than a large spared unit that can be switched over in ten minutes. Take into account lost production per hour, spare availability, lead time on the critical part, safety and environmental consequence, and whether failure is likely to cascade.
That ranking then sets the depth of monitoring, and it is legitimate — necessary, in fact — for the tiers to look very different. Critical unspared machines justify a full route point set and possibly continuous monitoring. Important spared machines justify a standard route. Everything else justifies a periodic walk-round with a meter, or nothing at all.
A programme that treats every machine the same is spending its scarcest resource — analyst hours — uniformly across assets whose value is anything but uniform.
Where the points go, and why bearings decide it
Measure at the bearings. That is where the load path passes from the rotor into the structure, and it is where the fault information is least attenuated. A point on a guard, a fan cowling or a piece of sheet metal is measuring the panel, not the machine.
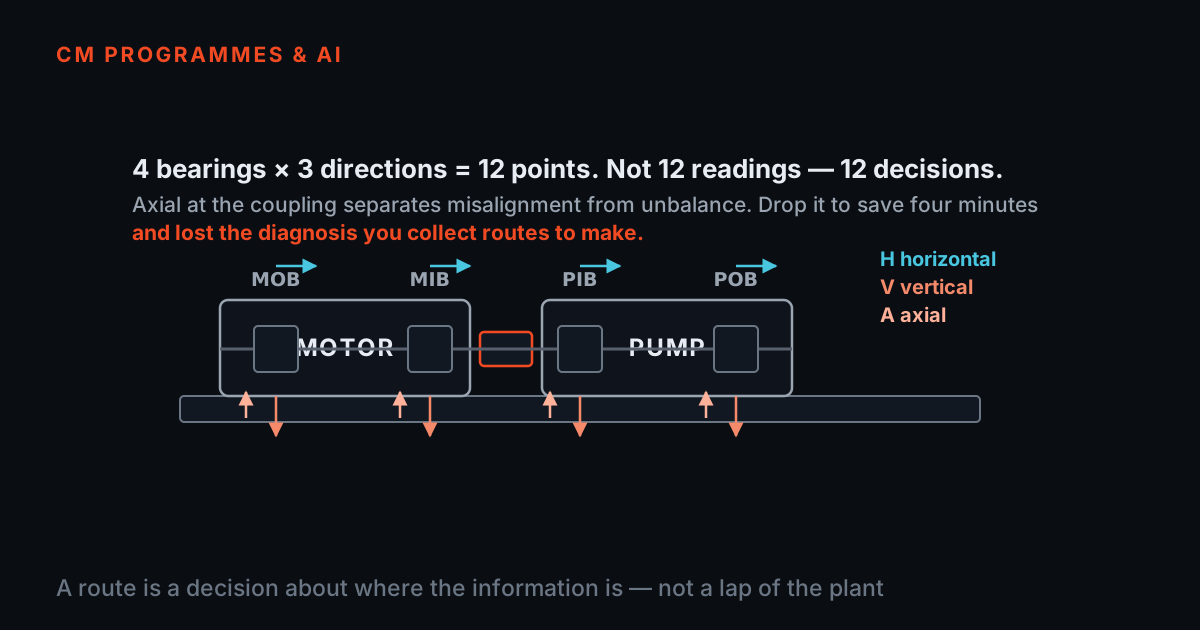
For a standard motor–pump train that gives four locations: motor drive end, motor non-drive end, pump drive end, pump non-drive end. Each location then takes directions.
Horizontal is usually the most responsive, because most machines are less stiff horizontally than vertically — unbalance shows here first. Vertical compared against horizontal is what reveals looseness and soft foot: a vertical reading approaching or exceeding horizontal is unusual and diagnostic. Axial is the one people skip and the one that decides misalignment, because axial energy at 1× and 2× is the classic signature and it is invisible in the radial directions.
Three directions at four locations is twelve points per train, which is more than many programmes carry. If you must reduce, reduce thoughtfully: horizontal and axial at both coupling-side bearings catch the majority of what develops, and the outboard verticals are the first things to drop. Dropping axial to save time is the common choice and the wrong one.
Build the route and watch it cost you
- Δf = F max ÷ lines, and the record time is its reciprocal. 5,000 Hz at 400 lines is Δf = 12.5 Hz and a 0.08-second record; 200 Hz at 3,200 lines is Δf = 0.0625 Hz and a 16-second record, before averaging multiplies it.
- A point with the wrong F max is not a weaker measurement, it is a worthless one — the evidence is outside the span and no amount of trending recovers it.
- On a short-record route, most of the time is mounting and walking, not acquiring. That is why pruning points saves more than coarsening resolution.
Everything so far has been judgement. This part is arithmetic, and it is worth doing once with real numbers because it decides whether the route survives contact with a Tuesday.
Two numbers come out of the analyser setup. The line spacing is Δf = F max ÷ lines, and the record time you must stand there for is T = 1 ÷ Δf. So 5,000 Hz at 400 lines gives Δf = 12.5 Hz and T = 0.080 seconds — instant. The same 400 lines at 200 Hz gives Δf = 0.5 Hz and T = 2 seconds. And 200 Hz at 3,200 lines gives Δf = 0.0625 Hz and T = 16 seconds for a single record. Ask for four averages at 50 per cent overlap and that becomes 16 × (1 + 3 × 0.5) = 40 seconds, at one point, on one machine.
Now the part that catches people. Resolution is not a nicety you trade away for speed; some diagnoses are impossible without it. On a 1,490 rpm motor, 4× running speed is 99.33 Hz and twice line frequency is 100.00 Hz — 0.67 Hz apart. To call those two peaks separate you need Δf of about 0.22 Hz or better, which the 200 Hz / 3,200-line setting delivers and the 5,000 Hz / 400-line setting misses by a factor of fifty-six. Collect that point a hundred times at 12.5 Hz per line and you still cannot say whether the motor has an electrical problem or a mechanical one. And note how that separation is made: by resolution, at the machine's own fixed speed. Nothing here asks you to vary the speed, because almost nothing on a plant route can be varied.
The builder below makes both sides of the trade real. Cycle each cell through — (skip it), OA (a 2-second overall), SP (a spectrum at your route setup) or LR (a low-range spectrum, fixed at 200 Hz and 3,200 lines). The panel computes the route time from your own mounting and walking figures, and lists what the resulting settings can and cannot detect, with the limiting number in each case.
Three comparisons are worth making in order. Six-point standard opens at 1 h 18 min across 25 trains and covers five of the seven mechanisms. Press Twelve-point full: doubling the points to twelve costs another forty minutes and buys exactly one more mechanism — looseness, which needs a vertical next to a horizontal. Now press Coupling-side only: still six points, still 1 h 18 min, but six mechanisms covered, because those six sit at the two bearings either side of the coupling with all three directions. Same budget, better route. That is what point selection is actually for.
Then break it deliberately. Set F max to 500 Hz and watch the bearing line go out: ten BPFO harmonics reach 760 Hz, so a 500 Hz span cannot carry the harmonic family that makes a bearing diagnosis a diagnosis. The points are all still there, the route takes exactly as long as it did, and the data is worth nothing for that fault. Finally press Chase the electrical — two low-range points at the motor, and the last mechanism comes in.
The train. A direct-coupled motor and end-suction pump, five vanes, 9-ball bearings with a ball-to-pitch diameter ratio of 0.32 and zero contact angle, on a 50 Hz supply. Everything below is computed from those numbers and the speed you set — nothing is looked up. Two peaks count as separated when Δf is no more than a third of the gap between them, because a Hanning window spreads one line over about 1.5 bins.
| Horizontal | Vertical | Axial | |
|---|---|---|---|
| MOT‑NDE | |||
| MOT‑DE | |||
| PMP‑DE | |||
| PMP‑NDE |
Model: one analyser, one technician, no queueing for permits and no machine found stopped. An OA point is a 2 s overall reading. The LR point is fixed at 200 Hz and 3200 lines whatever the route setup is, because that is what a low-range spectrum is for. Real routes run longer than this arithmetic says; the point of the arithmetic is the ratio between choices, not the absolute figure.
Interval: fast enough to see it coming
- Sample at least two or three times inside the expected warning period, so a developing fault reads as a trend rather than as one alarming reading you cannot tell from a bad measurement.
- A moderately loaded rolling-element bearing usually gives weeks to months of warning; a fast-developing fault on a high-speed machine may give days, and a monthly route does not catch it late — it misses it.
- A single plant-wide interval is a compromise nobody chose. Monthly for most, weekly for the critical few, continuous for the handful whose failure mode outruns any route.
The interval has to be short relative to how quickly the failure you are trying to catch develops. That development time — sometimes called the P-F interval, from potential failure to functional failure — is the number that should set your schedule, and it varies enormously by failure mode.
A rolling-element bearing spall on a moderately loaded machine typically gives weeks to months of warning. Monthly monitoring catches it. A high-speed machine with a rapidly progressing fault may give days, and monthly monitoring will miss it entirely — not detect it late, miss it. Lubrication starvation can go from normal to seized in hours, which no route interval catches; that one needs continuous monitoring or it needs to be handled by lubrication practice rather than by vibration.
The practical rule is to sample at least two or three times within the expected warning period, so a developing trend is visible as a trend rather than as a single alarming reading you cannot distinguish from a bad measurement.
It follows that a single plant-wide interval is a compromise nobody chose. Monthly for most, weekly for the critical few, continuous for the handful whose failure mode is faster than any route — that is a schedule with a reason behind it.
What to stop collecting
- Three tests, applied to every point on the route: has anyone ever acted on it, does it duplicate a point next to it, and has anyone opened the data?
- The test is not whether a point has alarmed. It is whether a decision would follow if it did.
- A four-hour route that gets walked and read beats a two-day route that gets half-walked and archived unopened — and the second state is far more common than anyone admits.
This is the part that rescues struggling programmes, and it is almost always resisted.
Go through the route and find the points that nobody has ever acted on. Not points that have never alarmed — points where, if they did alarm, no decision would follow. A reading on a machine that runs to failure by policy and is replaced from stores in an hour is a reading with no consequence. Collecting it costs analyst time and adds nothing.
Find the points that duplicate. Three directions on a small direct-coupled fan where the axial and horizontal have tracked each other identically for four years is not three measurements; it is one measurement collected three times.
Find the machines whose data nobody has opened. If a machine's spectra have not been looked at in two years, either it should not be on the route or the route is too long to walk properly — and both diagnoses lead to the same action.
The aim is a route that is completed on schedule, every time, with the data actually reviewed. A four-hour route that gets walked and read beats a two-day route that gets half-walked and archived unopened, and the second is a much more common state than anyone likes to admit.
Consistency is what makes a trend mean anything
A trend is a comparison across time, so everything that is not the machine's condition has to be held still. Same point — mark it physically, do not rely on memory or on 'about here'. Same mounting method, because a magnet and a stud do not measure the same bandwidth. Same direction, same speed, same load, same operating state.
A reading taken at 60% load and compared against one at 100% load has changed for a reason that has nothing to do with the bearing. So has one taken with a hand-held probe against one taken on a stud pad. Most 'sudden increases' investigated in a mature programme turn out to be a change in how the measurement was taken.
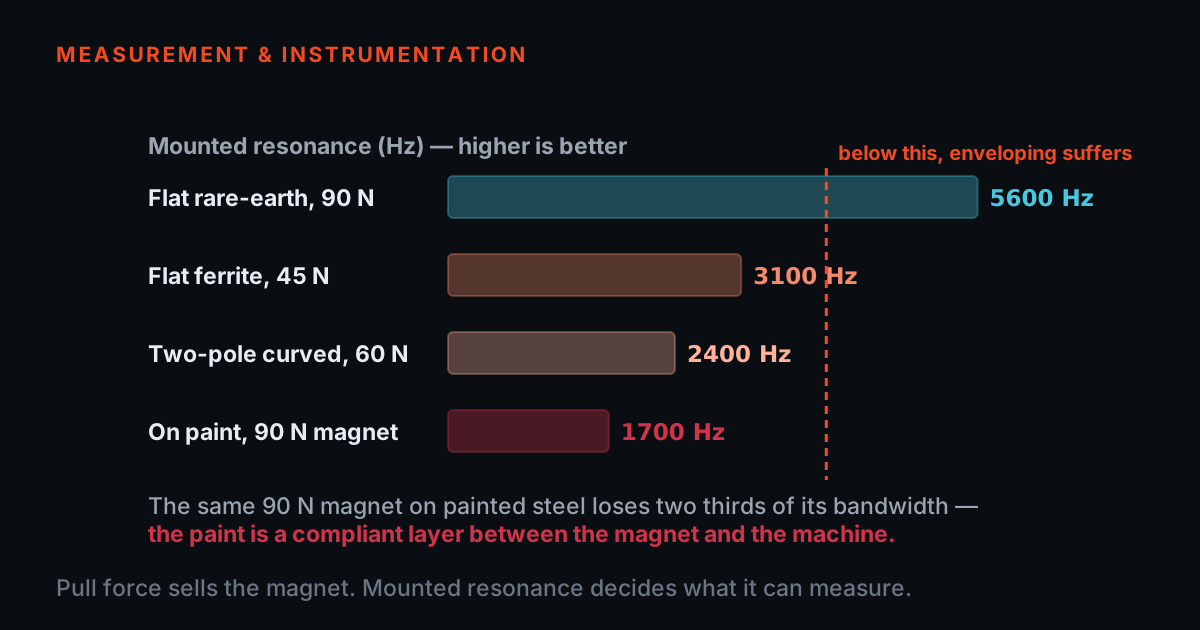
Permanently installed mounting pads are the cheapest fix available for this and they repay themselves quickly, because they remove the largest single source of route-to-route variation. If you do nothing else to a struggling route, put pads on the points you care about. Where a permanent pad is not practical, a quick-release magnetic mount seated on a marked, spot-faced position is the working compromise — it fixes the position, which is most of the variation, while accepting a lower usable bandwidth than a stud. What it will not do is make a magnet and a stud comparable, so do not mix the two on the same trended point.
- Mark each point physically, and measure that mark every visit.
- Fit a permanent pad where you can, and a quick-release magnet on a marked, spot-faced position where you cannot.
- Record speed, load and operating state alongside every reading.
- Keep one mounting method for the life of a trended point.
- Trend a stud reading against a magnet reading on the same point.
- Place the sensor from memory, or 'about here'.
- Compare a 60% load reading against a 100% load one and call the difference condition.
- Use a magnet on a point you envelope — its usable bandwidth will not reach.
TIERA instruments that do this work.
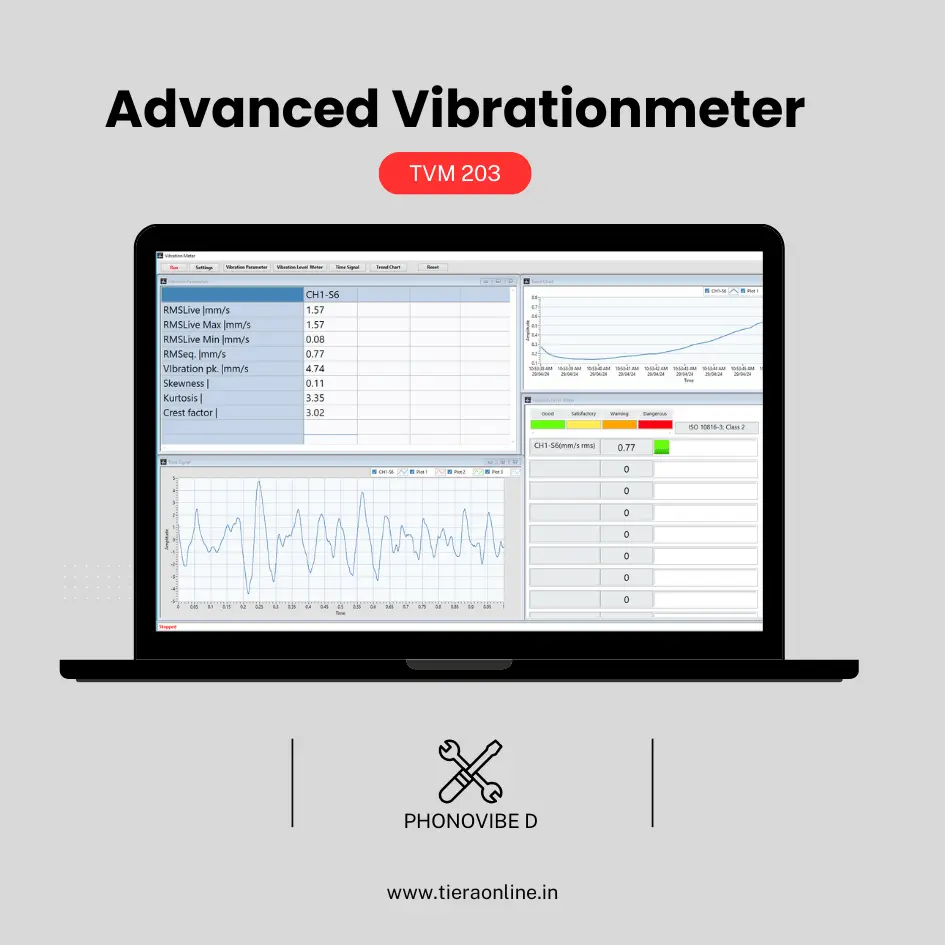
TVM 203 Advanced Vibration Meter
The vibration-meter software layer for a PhonoVibe D — the light end of the ladder, for the walk-round tier where a full analyser workflow is more than the point needs.

Field Vibration Starter Kit
Sensor, cable, mounting and meter matched as a set — the usual first purchase for a route programme.
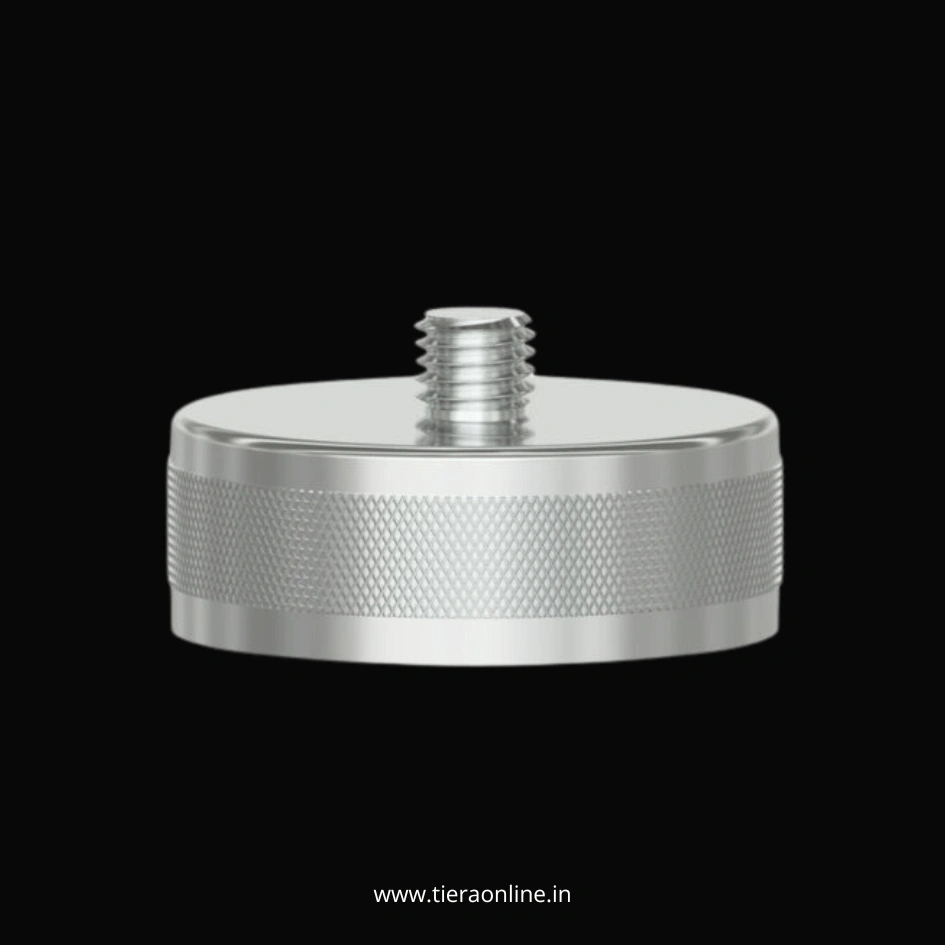
Magnetic Mounting Pad for Vibration Sensor
A quick-release, repeatable interface at a marked walk-round point. Note the trade: a magnet is the portable compromise, not the permanent pad — for high-frequency work such as enveloping, use a stud or adhesive mount instead.
From the TIERA store
The kit for this job
What we would actually put in front of someone doing the measurement this post describes — not the whole catalogue.
- TVM 203 -Advanced Vibrationmeter (Phonovibe D)Use Cases Off route Machine Vibration analysis Product Development & Research₹30,240View →
- Field Vibration Starter KitEverything to start walk-around vibration monitoring in the field — a 4-channel IEPE DAQ, a general-purpose accelerometer and a sensor cable in one indicative-priced kit.Request priceView →
- Magnetic Mounting Pad for Vibration sensorTMA-101-1A : SS 304 Magnetic Mount for Accelerometers and Vibration Sensors.₹800View →
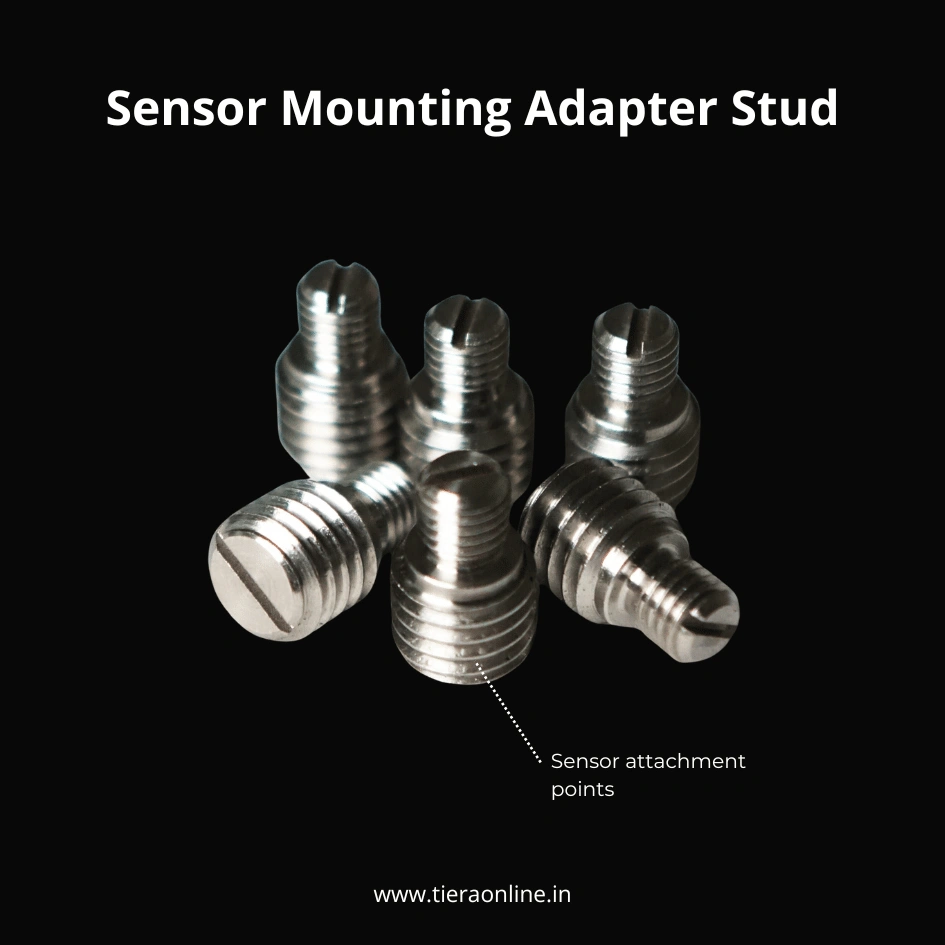 Sensor Mounting Adapter StudTM101-1A : TIERA SS304 Adapter Stud for sensor mounting₹260View →
Use cases
Where this shows up in the field
A route that gets walked.
We help plant teams cut routes down to the points that drive decisions, set intervals from failure-development time rather than from habit, and fix the points physically so a trend means something.
If your route is being half-completed, the answer is usually to make it shorter, not to buy a faster collector.
- TVM 203 vibration-meter software on a PhonoVibe D for the walk-round tier
- Field starter kit — sensor, cable, mounting and meter as a matched set
- Mounting pads — or a quick-release magnet on a marked position — to make points repeatable
Where this sits on the TIERA learning ladder.
The theory behind this article is covered free, in full, by the TIERA 101 primers: Vibration 101 (Foundations), Measurement Setup 101. They are self-paced, interactive, and end in an exam and a certificate.
The primer covers taking a good reading. Ranking assets by consequence, setting intervals against failure-development time and pruning a route are programme-level Cat II work.
TIERA 101 is a free introductory primer, not an accredited ISO certification, and its hours do not count towards the formal training ISO 18436 requires.