Published · Updated
Getting Wireless Vibration Data Into Your Own Software
Your plant's vibration history does not have to live on somebody else's server behind a per-sensor monthly fee. Here is the architecture that keeps it on your own network, the topic and payload design that makes it usable, the fleet bandwidth arithmetic that kills naive designs — you can drive it yourself — and the one security rule no vendor writes down.
Your data does not have to leave the plant
- Sensors to a gateway, the gateway on a network segment you control, your software subscribing to it. Nothing leaves the building unless somebody makes a decision that it should.
- The cloud platform is a commercial model, not an engineering requirement — decide it deliberately, with the recurring per-sensor fee and the data-ownership question on the table.
- A vibration history that cannot be exported is a vibration history you are renting.
Ask three wireless condition-monitoring suppliers what happens to your data and you will get three versions of the same answer: it goes to their platform, you log in to look at it, and you pay a monthly figure per sensor for the privilege. That arrangement is so common that plants have stopped noticing it is a choice. It is a commercial model, not an engineering requirement, and the hardware does not care either way.
Look at what the gateway on TIERA's store page actually is. It takes readings from the sensors over Bluetooth Low Energy, it sits on your network over Wi-Fi (802.11 a/b/g/n/ac) or Ethernet, it carries 64 GB of storage of its own, it accepts up to 30 sensor inputs, and it speaks MQTT, WebSocket, Modbus TCP/IP. Its web application comes preloaded on it and is reached from any machine on the same network as the gateway — no downloads, no account with anybody, and its own store page says it is designed to be integrated into third-party vibration analysis software. Every one of those is published on the product pages in this repository, and together they describe a box that is perfectly happy to be a data source rather than a subscription.
So the architecture this post argues for is the boring one. Sensors talk to a gateway. The gateway sits on a segment of the plant network you control. Software you chose — the preloaded web application, a historian you already own, your own code, or an analysis package on an engineer's PC — subscribes to the gateway. The data is written to storage you can point at, backed up by the team that backs up everything else, and readable in ten years by whoever is still there. Nothing leaves the building unless somebody makes a decision that it should.
That position is TIERA's engineering judgement rather than a manufacturer's instruction, and it is worth being clear about what it does and does not claim. It does not claim cloud platforms are bad; a multi-site group with no plant IT staff has a genuine reason to buy one. It claims that the decision should be made deliberately, with the recurring cost and the data-ownership question on the table, rather than inherited from whoever quoted first. And it claims the plant should still be able to get its own raw data out, because a vibration history that cannot be exported is a vibration history you are renting.
The rest of this post is the engineering behind that: what actually moves and how much of it, how to design the topics so a subscriber can be written by a normal person, the bandwidth arithmetic that decides whether an off-site design is even possible, and the security rule that matters more than all of it.
What actually moves, and how often
Before any of this can be sized, one question has to be answered honestly: what is a "reading"? The word covers two things that are between two and three orders of magnitude apart, and almost every bandwidth argument in condition monitoring is really a disagreement about which one somebody meant.
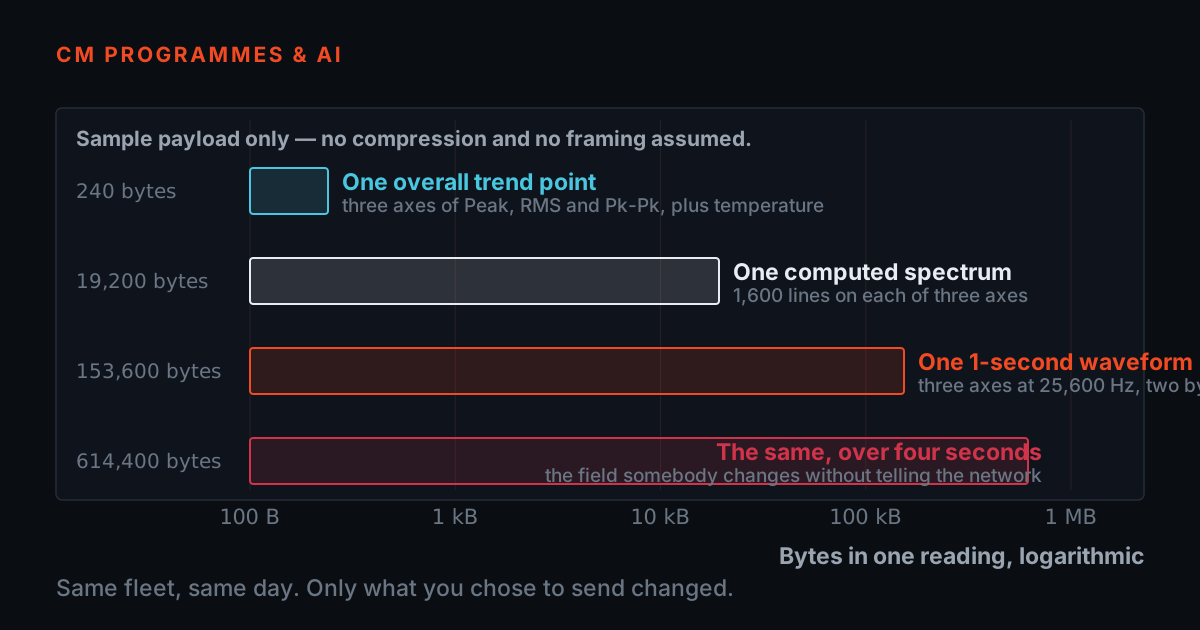
A TREND POINT is a handful of numbers. An overall level per axis in Peak, RMS and Pk-Pk, plus a temperature, is ten scalars. Wrap them in the message the GATEWAY sends up to your software — a timestamp, a device identifier and a point identifier — and you have 240 bytes — and note where most of those bytes went. The envelope is bigger than the measurement. That is not a criticism of the envelope; it is the reason a design that sends ten numbers every minute costs far more than ten numbers a minute would suggest.
A WAVEFORM BLOCK is the raw time record. Three axes at 25,600 Hz for one second at two bytes a sample is 153,600 bytes: 640 times a trend point. Between them sits a computed spectrum — 19,200 bytes for 1,600 lines on three axes, about 8 times smaller than the waveform it came from, and enough to diagnose most of what a route diagnoses.
Every byte figure on this page is the SAMPLE PAYLOAD: no compression and no binary framing are assumed, so each one is an upper bound on what the samples themselves cost. A real deployment that packs its records into binary or compresses them comes out below these numbers, sometimes well below — a vibration waveform is not incompressible. That is deliberate. When you are sizing a link somebody has to pay for every month, the number you want is the one that cannot be exceeded, not the one a vendor's best case produces.
Cadence is the other half. These sensors' stated reading interval is one to twenty-four hours, so the honest range is one to twenty-four readings a day per point — and it multiplies straight through everything below. There is no economy of scale anywhere in this arithmetic, which is exactly why it surprises people: doubling the fleet doubles the data, doubling the cadence doubles it again, and lengthening the record from one second to four turns 153,600 bytes into 614,400 bytes. The last of those is the dangerous one, because record length is a field in a configuration screen and the person changing it is thinking about frequency resolution, not about the uplink.
One reading, four ways to send it, on a logarithmic scale because a linear one would draw the first row as nothing at all. Every byte figure is the sample payload only — no compression and no binary framing are assumed, so each one is an upper bound on what the samples themselves cost. Only the trend row carries a message envelope, because on a trend point the envelope is most of the message and on a waveform it is a rounding error.
| What is sent | Kind | Bytes | On a log scale | Times a trend point |
|---|---|---|---|---|
| One overall trend point three axes of Peak, RMS and Pk-Pk, plus temperature · includes its message envelope |
trend | 240 bytes | 240 B | — |
| One computed spectrum, 1,600 lines three axes, one 32-bit magnitude per line, computed before it is sent |
spectrum | 19,200 bytes | 19.2 kB | 80 × |
| One 1-second triaxial waveform three axes at 25,600 Hz, two bytes a sample |
waveform | 153,600 bytes | 153.6 kB | 640 × |
| One 4-second triaxial waveform the same three axes, four times the record — the field somebody changes |
waveform | 614,400 bytes | 614.4 kB | 2,560 × |
Publish and subscribe, in one page
- Design the topic namespace as a hierarchy, largest thing that will never change first: site, area, line, asset, point, axis — one meaning per segment, decided before the first sensor is commissioned.
- Then every subscriber takes exactly the slice it wants with a wildcard, and none of them contains a line of string parsing.
- Insist on birth and death messages. Without them a dead sensor and a healthy sensor with nothing to report look identical, and quiet failure is what wireless condition monitoring is most prone to.
Most industrial data plumbing is a publish-and-subscribe system, and the gateway on the store page supports the three ways of doing it that matter: a message broker, a persistent socket, and a register-based protocol for the equipment that only speaks that. If you have never written a subscriber, the whole model fits in a paragraph. Something publishes a message to a named TOPIC. Anything that has subscribed to that topic, or to a pattern that matches it, receives a copy. Nobody has to know who else is listening, and adding a second consumer later changes nothing about the publisher.
The single decision that determines whether this is pleasant or miserable to live with is the topic namespace, and it is made once, before the first sensor is commissioned, usually by whoever is in the room. Design it as a HIERARCHY, from the largest thing that will never change down to the smallest thing that might: site, then area, then production line, then asset, then measurement point, then axis. Every segment has one meaning and only one. Then a subscriber takes exactly the slice it wants with a wildcard — one machine for a dashboard, one line for a supervisor, the whole site for the historian — and none of them contains a line of string parsing.
The failure mode is the flat namespace, where a topic is one segment with the site, the asset and the point glued together by underscores. It works beautifully at ten sensors, which is why it survives the pilot. At two hundred it means every consumer carries a parser, every parser has its own idea of the separator, no wildcard can select a production line, and renaming an asset breaks four systems written by three people who have left. This is not a hypothetical: a flat namespace is the commonest reason a working pilot turns into an integration project.
Four broker behaviours decide how simple your consumer can be, and they are worth understanding before you need them. QUALITY OF SERVICE is the delivery promise: at most once, at least once, or exactly once. At least once is usually the right choice for condition monitoring — you would rather have a reading twice than not at all — but it means your consumer must handle a duplicate, and the cheapest way is a natural key of point plus timestamp so a repeat simply overwrites. RETAINED MESSAGES mean the broker keeps the last message on a topic and hands it to any new subscriber immediately, which is the difference between a dashboard that shows the machine on load and one that shows blank panels until the next reading is due. BIRTH AND DEATH MESSAGES are how a subscriber knows a device is alive: the device announces itself when it connects, and registers a message with the broker to be published on its behalf if the connection drops. Without them, a dead sensor and a healthy sensor with nothing to report look identical, and quiet failure is the failure mode wireless condition monitoring is most prone to. PER-TOPIC ACCESS CONTROL is the security half, and it appears again in the last section.
One deliberate omission, and it is worth stating rather than hiding. This section describes the PATTERN and not any particular product's namespace, payload field names or connection limits. TIERA has an integration manual in its archive, but it documents the PREDECESSOR gateway — a product TIERA does not sell — and a specification attached to a discontinued product's name is not a specification for the one on the store page. So the shape is here, and the exact topic strings and field names are a question for the gateway you actually buy, in writing, before you buy it. That question is on the checklist at the end.
Size the link before you buy it
Here is the bench. Eight controls — fleet size, points per sensor, channels, sample rate, record length, bytes per sample, cadence, and the uplink you actually have — and two numbers out: what the fleet costs per day, and what it asks of the link. The chips along the top load the cases this post discusses, so you can reproduce every figure above rather than taking it on trust.
Watch the two rates, not the volume. The AVERAGE is a day's bits spread evenly over a day, and it is a floor for sizing a link, never a specification — if the average does not fit, nothing fits and the backlog grows forever, but the average fitting proves very little. Real condition-monitoring traffic is nothing like even. A scheduled fleet reports in a window and is silent the rest of the day, so the rate the link is actually asked to carry is the BURST: one round of the whole fleet, divided by however long you give it. This page assumes a 15-minute reporting window, which is TIERA's engineering judgement and not a property of anything you buy; a plant that wants a tighter window is asking its link for proportionally more.
The opening position is the post's headline case: 500 waveform points reporting twice a day. That is 153.6 MB a day, an average of 14.22 kbps, and a burst of 682.67 kbps — 48.0 times the average. Anybody who sized that link on the average figure has under-provisioned it by a factor of nearly fifty, and the symptom will not be an error message. It will be a reporting window that quietly stretches from fifteen minutes to two hours, and readings across a machine train that stop being simultaneous, which is the thing that ruins comparisons between bearings on the same shaft.
Three chips fail, and they fail in two genuinely different ways. TIGHT means the daily average fits but the round does not arrive inside its window: nothing is lost, the gateway buffers and dribbles, and the reporting window stretches. OVERSUBSCRIBED means the average itself does not fit: a day of data cannot be delivered in a day, the buffer fills, and the oldest readings are dropped. The half-megabit chip is the first kind — its average fits 36.0 times over and it still cannot deliver a round. The cellular chip is the second kind: 85.33 kbps of average against 64.00 kbps, which is not a link-sizing problem but an architecture problem wearing one's clothes.
Then click the last two chips in order. The wish list — 4,000 points, four-second triaxial records, hourly — is 59.0 GB a day, and over 2.00 Mbit/s of dedicated uplink it is hopeless twice over: the daily average alone is 2.7 times the link, and the round it has to deliver inside the window asks for 10.9 times it. Change nothing except the destination, put it on the plant LAN, and the identical fleet is unremarkable. That is the whole argument of this post in two clicks: most wireless bandwidth crises are not created by the measurement, they are created by the decision to send the measurement somewhere far away.
- One block
- —
- Fleet volume
- —
- Daily average rate
- —
- Rate while reporting
- —
This is a sizing model with stated assumptions, and it is four lines: one block is channels × sample rate × seconds × bytes per sample; one round is points × block; a day is round × readings per day; and a rate is bits over seconds. No compression and no binary framing are assumed, so every byte figure is the sample payload and an upper bound on what the samples cost — a real deployment that packs or compresses its records comes out below it. The average rate is a floor for sizing a link, never a specification, because a scheduled fleet delivers its whole round inside one reporting window and is silent for the rest of the day; the burst is the number your link has to carry. Traceable to a manufacturer, from files in this repository: 64 GB of on-board storage, 30 sensor inputs and MQTT, WebSocket, Modbus TCP/IP support, all from the gateway's store page. TIERA's engineering judgement, not anybody's datasheet: the 15-minute reporting window, the 200-byte message envelope, the uplink ladder, and every word width above two bytes — the dynamic sensors' bit depth is not published, so this page treats it as an input you set rather than a specification it knows.
Compute at the edge, or ship the waveform
- The resolution is usually not to choose: trend everything continuously, keep a rolling window of full waveforms on the gateway's own storage, and pull the raw record only for points that have gone interesting.
- That is straightforward when the gateway and the storage are yours, and an expensive negotiation when they belong to somebody else.
- If you are building a dataset to train anything, the waveform is not optional — a spectrum with the phase thrown away is a decision made permanently on your behalf.
The bandwidth arithmetic forces a design decision that is usually made by accident: how much analysis happens before the data moves. There are three honest positions and the table below prices all of them on the same fleet — 500 points, 2 readings a day.
Ship OVERALLS ONLY and the fleet costs 240.0 kB a day. This is the classic route-replacement programme in wireless form: a trend line per point, alarms on the trend, and a human dispatched when something moves. It is genuinely useful, it will catch the majority of developing faults given decent alarm limits, and it is cheap enough that the bandwidth conversation never happens. What it cannot do is tell you WHAT is wrong, because a number that has doubled is a number that has doubled.
Ship A COMPUTED SPECTRUM as well and the fleet costs 19.2 MB a day — 80 times more, and still under two kilobits per second on average. Now the diagnosis is possible remotely: bearing tones, gear mesh, harmonics of running speed, sidebands. For most plants this is the sweet spot, and it is the position TIERA recommends by default — not because the arithmetic says so on its own, but because the diagnostic value per byte is highest here by a wide margin. That is TIERA's engineering judgement, and a plant with different priorities can reasonably land elsewhere.
Ship THE FULL WAVEFORM and the fleet costs 153.6 MB a day at an average of 14.22 kbps — a hundred times the overalls case, and remember that the average is a floor rather than a specification, so the link has to be built for the burst rather than for that figure. What you buy for it is the only thing the other two cannot give you: the ability to ask a question you had not thought of yet. Envelope demodulation with a band you choose later, order tracking, a different window, a machine-learning feature set that did not exist when the reading was taken. If you are building a dataset to train anything, this is not optional — a model can only learn from what was kept, and a spectrum with the phase thrown away is a decision made permanently on your behalf.
The resolution is usually not to choose. Trend everything continuously, keep a rolling window of full waveforms on the gateway's own storage, and pull the raw record only for points that have gone interesting or on a slow schedule for the assets that matter. That is a straightforward thing to build when the gateway is on your network and the storage is yours, and a difficult and expensive thing to negotiate when both belong to somebody else — which is, quietly, one of the strongest arguments for the architecture in the first section.
One fleet — 500 points, 2 readings a day — and three decisions about what leaves the gateway. Every figure is computed from the payload sizes in the table further up, so this table and that one cannot disagree. The average column is a floor for sizing a link, never a specification: the same fleet asks for very much more than this while it is actually reporting, which is what the bench above shows you.
| What the gateway sends | Per reading | Per day | Per month | Average rate |
|---|---|---|---|---|
| Overalls only, computed on the sensor the trend line moves, and nothing else leaves the plant |
240 bytes | 240.0 kB | 0.0 GB | 0.02 kbps |
| Overalls plus a computed spectrum enough to diagnose most of what a route diagnoses |
19,200 bytes | 19.2 MB | 0.6 GB | 1.78 kbps |
| The full waveform, every time everything, kept, re-analysable — and the reason this post exists |
153,600 bytes | 153.6 MB | 4.6 GB | 14.22 kbps |
When the link drops — and it will
Every integration is written for the case where the network works, and every integration then meets a switch reboot, a firewall change nobody mentioned, a power cut in the plant office, or a cellular modem that has decided it is in a tunnel. The behaviour on the way back up is what separates a system that survives its first year from one that quietly loses a fortnight of history and nobody notices until somebody goes looking for a trend.
STORE AND FORWARD is the first requirement and it is the reason on-board storage matters. The gateway keeps readings while the link is down and sends them when it returns. The honest question is never "does it buffer" — everything buffers — but "for how long", and that is a division anybody can do: storage over daily volume. On the published 64 GB, the headline fleet in this post is covered for 416.7 days — about 1 year, and the wish-list fleet for about a day. Ask a supplier for the buffer size in bytes and in readings, in writing, and do the division yourself before you sign.
A buffer is bounded, so the second question is what happens when it fills, and there are only two answers: the oldest data is dropped, or the newest is refused. For condition monitoring the first is nearly always correct — a recent reading is worth more than an old one — but it must be a stated behaviour rather than an emergent one, and the system must say out loud that it happened. Silent data loss with a full trend line either side of the gap is the worst possible outcome, because the gap is invisible in exactly the view an analyst uses.
DEDUPLICATION is the price of a delivery guarantee. If the transport promises at-least-once delivery, the same reading will sometimes arrive twice, usually right after a reconnection when the gateway re-sends everything it is unsure about. Handle it at the consumer with a natural key — point identifier plus measurement timestamp — so a duplicate overwrites rather than appending. A trend chart with a doubled point after every outage is the classic symptom, and it is one line of database constraint away from never happening.
CLOCK SKEW is the one that ruins analysis rather than merely annoying people, and it is worth being specific about why. Battery-powered sensors keep time with a cheap oscillator and can drift seconds a day; a gateway that stamps readings on arrival rather than at capture adds queueing delay to the error. For trending, none of this matters. For anything that compares phase between points on a machine train, or that assumes two channels were sampled together, it matters completely: a reading whose timestamp is wrong by seconds is not a reading you can use with another one. Fix it at the source — the sensor's clock disciplined by the gateway, the gateway's by a network time source you control — and put the sample rate the device actually achieved into the payload rather than the one it was configured with, because the two are not always the same number.
And a smaller thing that costs a surprising amount of an integrator's life: back off when you reconnect. A gateway that retries every second against a broker that is down, in a fleet of gateways all doing it together, produces a thundering herd that stops the broker recovering. Exponential backoff with a random component is four lines of code and it is the difference between an outage and an outage that will not end.
The link will drop. The only question that matters is for how long you can afford it to, and that is a division: the gateway's published 64 GB of on-board storage over the fleet's daily volume. This treats all of the storage as available buffer, which is generous — some of it holds the application and its own history — so read the answers as a ceiling. The bar is logarithmic, because the span between the first row and the last is four orders of magnitude.
| The fleet | Per reading | Per day | Outage covered |
|---|---|---|---|
| 500 points of overalls, twice a day | 240 bytes | 240.0 kB | 266,666.7 days — about 731 years |
| 500 points of 1-second triaxial waveform, twice a day | 153,600 bytes | 153.6 MB | 416.7 days — about 1 year |
| 1,000 sensors, four points each, 4-second records, hourly | 614,400 bytes | 59.0 GB | 1.1 days |
The security section nobody writes
- Give every device its own credential. A shared secret cannot be revoked for one device, so the first compromised sensor forces you to re-provision every sensor you own.
- Encryption whose certificate is accepted blindly is encryption without authentication — it protects you against nobody who matters.
- Ask the six closing questions in writing before you order: namespace and sample payload, protocol options and documentation cost, buffer size and fill behaviour, where the timestamp is applied, per-device and per-topic access, and raw export on the day you stop paying.
Condition-monitoring integration guides end at the payload schema. This is where the section that should follow it would go, and it is missing from almost every one of them — including, in fairness, most of the ones written by people who know better, because it is the section that makes a sale harder rather than easier.
Start with the basic hygiene, which is not the interesting part but is the part that gets skipped. Encrypt in transit, and confirm that the certificate is actually verified rather than accepted blindly, because a client that trusts any certificate has encryption without authentication and is protected against nobody who matters. Give every device its OWN credential, never a shared one baked into a fleet: a shared secret cannot be revoked for one device, so the first compromised sensor forces you to re-provision every sensor you own. Restrict each credential to the topics it needs — a sensor publishes its own asset's data and subscribes to nothing, a dashboard subscribes and publishes nothing — because per-topic access control is what stops a compromised device from impersonating the whole plant. Change the default password on the gateway, and change it before it goes on the network rather than after. Ask the supplier how firmware is updated and whether the update is signed, and remember that a device with no update path is a device with permanent vulnerabilities.
Now the rule that matters more than all of that put together, and the reason this section exists at all. A CONDITION-MONITORING GATEWAY MUST NEVER BE THE PATH FROM THE CLOUD TO THE PLC. Not restricted, not firewalled, not monitored: not a path at all. If there is a route from an internet-facing service, through the monitoring system, to the network that carries your control and safety systems, then the security of your machinery now depends on the security of a vibration dashboard, and a vibration dashboard is not built to carry that weight.
In practice that means four concrete things. SEGMENT the network: the monitoring gateway lives on its own segment, the control network lives on another, and there is no route between them — a separate VLAN with a firewall rule is the minimum, and physically separate infrastructure is better where the plant can afford it. Make the data flow ONE WAY: monitoring data goes outward from the plant, and nothing comes inward to a device that can reach control equipment. Where a plant wants that guaranteed in hardware rather than in configuration, a data diode or a one-way gateway is the mechanism, and for genuinely critical infrastructure it is worth the money. Keep the CREDENTIALS separate, so that nothing which can talk to the monitoring system holds anything that would authenticate against a control system, and no engineer's laptop bridges both by being logged into each. And REVIEW the remote-access path, because the way this rule is usually broken is not a designed route at all but a remote-support tool somebody installed on a machine that happens to sit on both networks.
The uncomfortable version of this is worth saying plainly, because it is the version that changes decisions. Condition monitoring is a system for reading numbers off machines. Nothing about it requires the ability to change anything on a machine, so it should not have that ability, and any architecture that gives it that ability has traded a safety property for a convenience nobody asked for. If a supplier's design requires a route from their cloud into a network that can reach your control system, that is not an integration constraint to be worked around. It is a reason to choose a different design — and the architecture in the first section, where the data stays on your own network and the only thing that ever leaves is an outward copy, is a reason it never comes up.
Finally, the questions to ask in writing before you order, because every one of them is cheap now and expensive later. What is the topic namespace, and can I see a sample payload for a trend point and for a waveform? What are the exact protocol options, and is there documentation for the interface, and does it cost anything? How big is the store-and-forward buffer, in bytes and in readings, and what happens when it fills? Is the timestamp applied at capture or at arrival, and does the payload carry the sample rate the device actually achieved? Are credentials per-device, and can access be restricted per topic? Can I export the full raw history in an open format, without a subscription, on the day I decide to stop paying you? A supplier who answers all six in writing has built something you can integrate. One who answers none of them has built something you can only rent.
TIERA instruments that do this work.
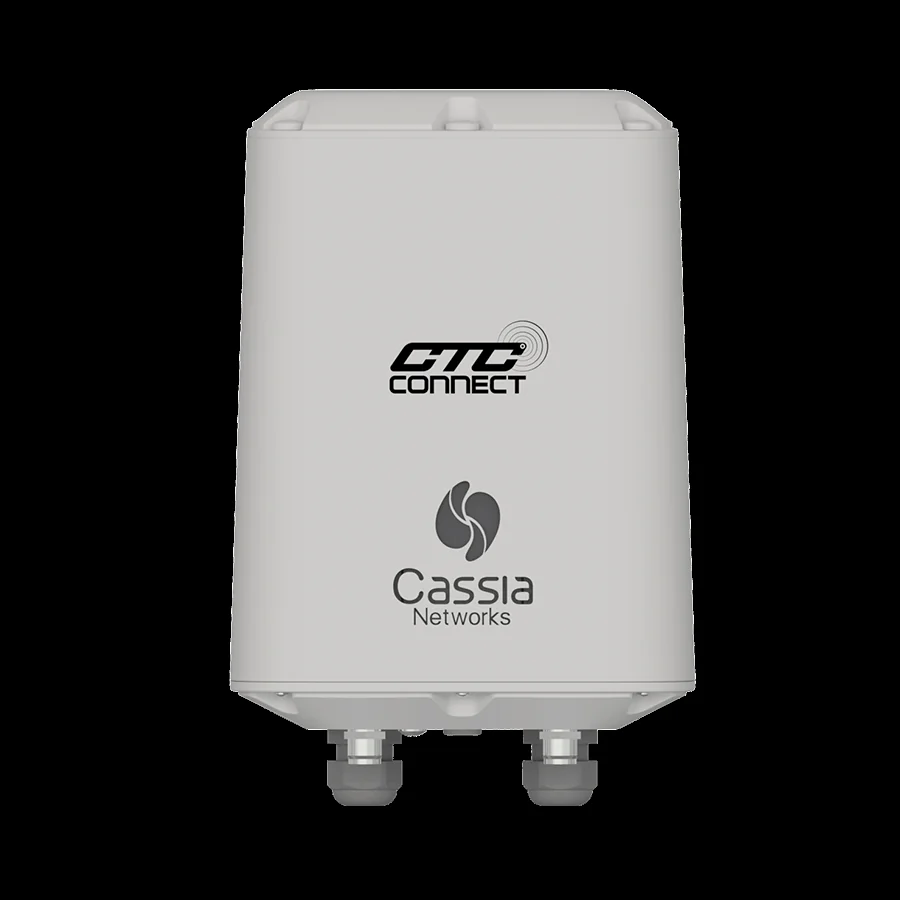
Access2000 Series — Long-Range Wireless Gateway & Network Controller
The box this whole post is about, and the reason the architecture in the first section is available at all. Three of its published specs are the ones integration actually turns on: it supports MQTT, WebSocket and Modbus TCP/IP, it sits on the plant's own network over Wi-Fi or Ethernet, and it carries 64 GB of on-board storage — which is the store-and-forward buffer the sixth section divides by your daily volume.
- Network Connectivity
- Wi-Fi (802.11 a/b/g/n/ac) or Ethernet
- Sensor Communication
- Bluetooth ® Low Energy 5.2 from CTC ConnectSens
- Storage
- 64 GB
- Input Count
- 30 sensor inputs* - Mix and match ConnectSens
- Power
- DC12V/2A or 57Vdc 350 mA (PoE)
- IP Rating
- IP66
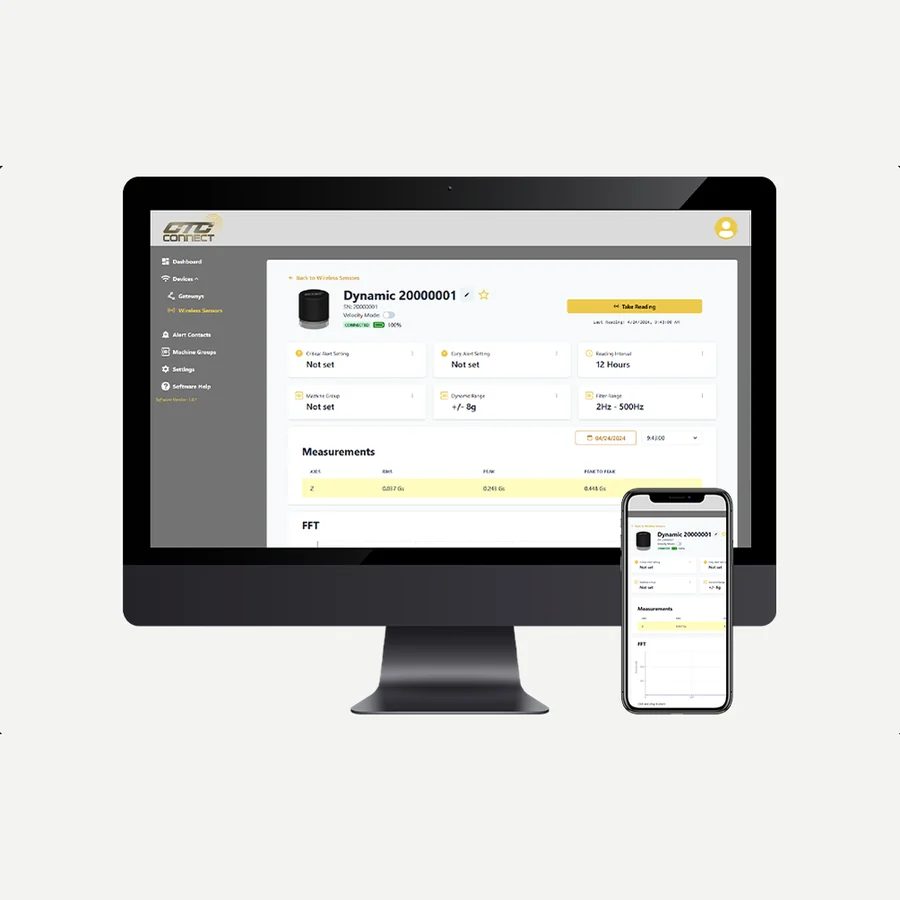
ConnectView Web App — Preinstalled on the Connect Wireless Gateway
The part that makes "your data does not leave the plant" a shipping product rather than a project. It comes preloaded on the gateway, needs no downloads and no account, and is reached from any PC, laptop, tablet or phone on the same network — and its own page states it is designed to be integrated into third-party vibration analysis software, which is the sentence the rest of this post is built on.
- Part Number
- ConnectView Web App
- Supplied
- Preloaded on the Connect Gateways — requires no additional downloads
- Access
- Any PC, laptop, tablet or smartphone connected to the same network as your other Connect Line products
- Integration
- Designed to be integrated into third-party vibration analysis software
- Functions
- Configure sensors, nickname sensors, create machine groups, view battery life, view basic vibration data
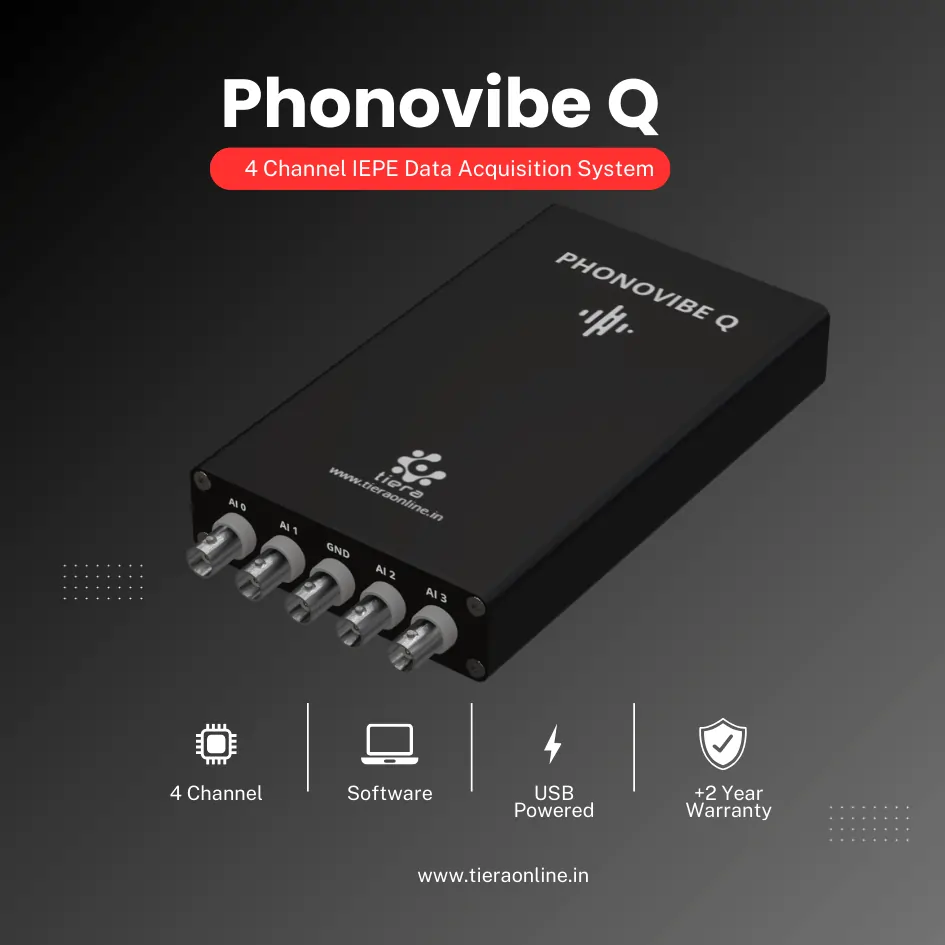
PhonoVibe Q — 4 Channel IEPE Data Acquisition System
The analysis end of the same argument. A wireless fleet that hands you raw records is only as useful as the software that opens them, and this is the wired chain TIERA builds in-house for the follow-up measurement — when a trend has moved and somebody has to stand at the machine and settle what it is before money is spent on a teardown.
- Channels
- Four channels, standard plug & play, USB powered
- Sensors
- Accelerometers, microphones, hammers, or any other IEPE sensors
- Measurements
- Time waveforms, frequency spectra, overall vibration levels, FRFs and octave measurements
- Software
- T-VIB base version — TSAP 201 Time and Spectrum with Post Processor
- Host
- Windows 10 or above
From the TIERA store
The kit for this job
What we would actually put in front of someone doing the measurement this post describes — not the whole catalogue.
- Access2000 Series - Long-Range Wireless Gateway & Network ControllerThe ACCESS2000 Series is a long-range wireless gateway and network controller used for connecting CTC Connect compatible products to the data analysis software of your choice via Wi-Fi or Ethernet.Request priceView →
- Connectview Web App - Basic Data Tools and Device Management Functionality, Comes Pre-installed On the Connect Wireless GatewayConnectView™ is CTC's powerful web-based application designed to simplify wireless vibration monitoring and sensor management while offering seamless integration with third-party vibration data analysis software.Request priceView →
- 4 Channel IEPE Data Acquisition System – Phonovibe QFour Channels Standard plug & play USB Powered Take data from accelerometers, microphones, hammers, or any other IEPE Sensors T- VIB Software to acquire time waveforms, frequency spectra, overall vibration levels, FRF’s and octave measurements ** Windows 10 or above Operating System ** T-VIB Software base version comes with Time and Spectrum with Post processor TSAP 201. Check out TVIB Software regarding more module options.₹2,88,000View →
Use cases
Where this shows up in the field
Send us your fleet size and cadence and we will do this arithmetic before you buy anything
TIERA supplies and supports the CTC Connect wireless range in India — the gateways, the sensors and the preloaded web application — and supports them here rather than pointing you at a portal. What is more useful than a quotation is the data-plane design, because the decisions in it are hard to reverse: the topic namespace, where the data is stored, who can export it, and whether the plant is signing up to a recurring per-sensor fee it did not have to.
Tell us how many points you want to monitor, how often, and whether you need waveforms or overalls, and we will come back with the daily volume, the rate your link actually has to carry while the fleet is reporting, how long the gateway's own storage covers an outage, and a topic and storage design you can hand to your IT team. Everything on this page is a sizing model with stated assumptions, and we will say so every time — but it is the same model, and you can drive it yourself above before we say a word.
- Access2000 gateways with MQTT, WebSocket and Modbus TCP/IP, on your network, with 64 GB of on-board storage
- ConnectView preloaded on the gateway — no downloads, no account, and designed to be integrated into third-party analysis software
- A written data-plane design per site: topic namespace, storage, retention, buffer sizing and the OT/IT segmentation rule
- PhonoVibe Q and T-VIB for the wired follow-up measurement, so a wireless alarm can be settled at the machine
Where this sits on the TIERA learning ladder.
The theory behind this article is covered free, in full, by the TIERA 101 primers: AI Condition Monitoring 101, Accelerometer & DAQ Selection 101. They are self-paced, interactive, and end in an exam and a certificate.
The free primers cover what a condition-monitoring data pipeline needs from the measurements feeding it, and how sensor and DAQ choices set what those measurements can contain. TCAT adds examined depth: deriving cadence, record length and retention from the faults being watched for rather than from a supplier's default, and defending a data architecture — including the parts that cost money and the parts that refuse a convenient shortcut — in front of the people who sign for it.
TIERA 101 is a free introductory primer, not an accredited ISO certification, and its hours do not count towards the formal training ISO 18436 requires.