Published · Updated
What Makes a Vibration Reading Trustworthy
4.2 mm/s is not a fact — it is a voltage divided by an assumed sensitivity. A short visual tour of sensitivity, drift, damage, and what back-to-back calibration against a reference actually proves.
4.2 mm/s is a voltage wearing a costume
- Engineering units appear only at the last step, when software divides by one stored number.
- If that stored sensitivity does not match what the sensor actually has today, every value downstream — RMS, spectrum peaks, alarm comparisons — is scaled by the same silent error, with nothing on screen to warn you.
No instrument measures millimetres per second directly. An accelerometer converts motion into a small voltage, that voltage rides down a cable, through a signal conditioner, into a DAQ, and only then does software divide by one stored number — the sensor's sensitivity, in millivolts per g — to turn electricity back into engineering units.
That one number is the entire bridge between physics and your report. If the sensitivity stored in the software does not match the sensitivity the sensor actually has today, every value downstream — RMS, spectrum peaks, alarm comparisons — is scaled by the same silent error, with nothing on screen to warn you.
A wrong sensitivity scales every number you report
Because the conversion is a straight division, a sensitivity error does not add noise or look strange — it rescales everything cleanly. A sensor believed to be 100 mV/g that actually outputs 90 mV/g makes every reading come out 10 percent low — the true level is about 11 percent higher than the number on screen, optimistic in exactly the wrong direction. The spectrum shape stays perfectly plausible.
The figure below shows one identical electrical signal converted with three assumed sensitivities. Same machine, same instant, three different truths — and only one of them crosses the alarm line. This is why a sensitivity check is not paperwork; it decides whether a machine gets stopped.
How sensitivity quietly stops being true
- Drift is slow; damage is instant. A dropped sensor, an over-range shock or a magnet slammed onto a machine can shift sensitivity in one moment.
- None of it announces itself — a sensor that drifted out of tolerance keeps producing clean, confident-looking waveforms.
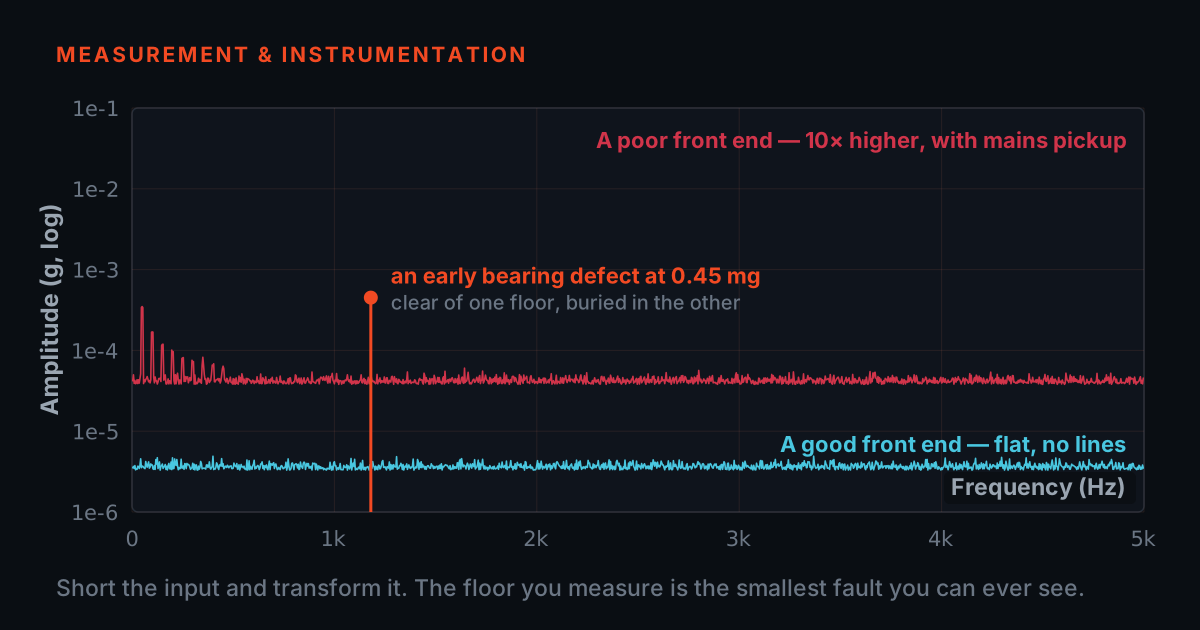
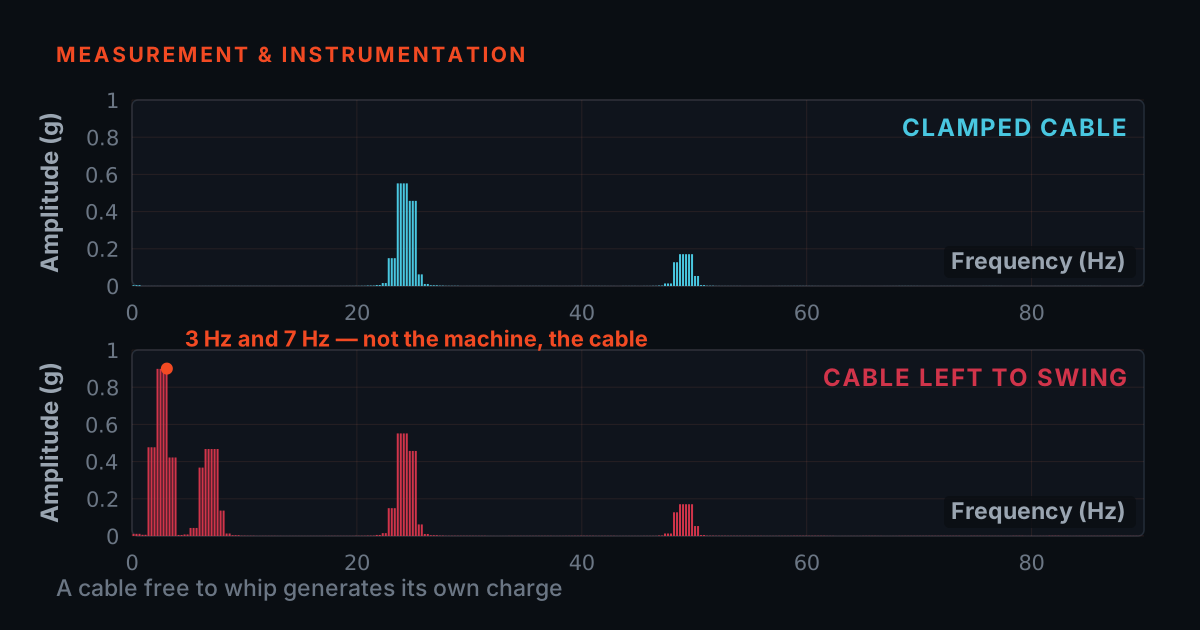
Sensitivity is not carved in stone. Sensing elements age and drift slowly with time and temperature cycling, and a single hard knock — a dropped sensor, an over-range shock, a magnet mount slammed onto a machine — can shift it in one instant. Connectors loosen, and cable damage adds its own errors: flexing cheap cable under vibration generates triboelectric noise that rides on top of the real signal, which is why low-noise and armored constructions exist.
None of this announces itself. A sensor that drifted out of tolerance keeps producing clean, confident-looking waveforms. The illustrative graph below shows the pattern: slow drift you can live with inside a tolerance band, then one drop event that silently pushes the sensor outside it between checks.
Mounting decides where the sensor is honest
Even a perfectly calibrated sensor is only honest over part of the frequency axis. Every mounting method — stud, adhesive pad, magnet — forms a spring-mass system with its own resonance, and readings near that resonance are amplified, not measured. A rigid stud mount keeps the flat, trustworthy region widest; a magnetic mount is faster to place but brings the resonance down into frequencies you may actually care about.
The practical rule: know your mounting's usable band, and treat peaks that sit near the mounting resonance with suspicion. This is also why a calibration result travels with a stated frequency — a sensitivity verified at a reference frequency describes the flat region, not the resonance.
Back-to-back calibration: what it actually proves
- Mount a reference sensor and the sensor under test on the same vibrating surface and the ratio of their outputs gives the test sensitivity — no absolute measurement of motion needed.
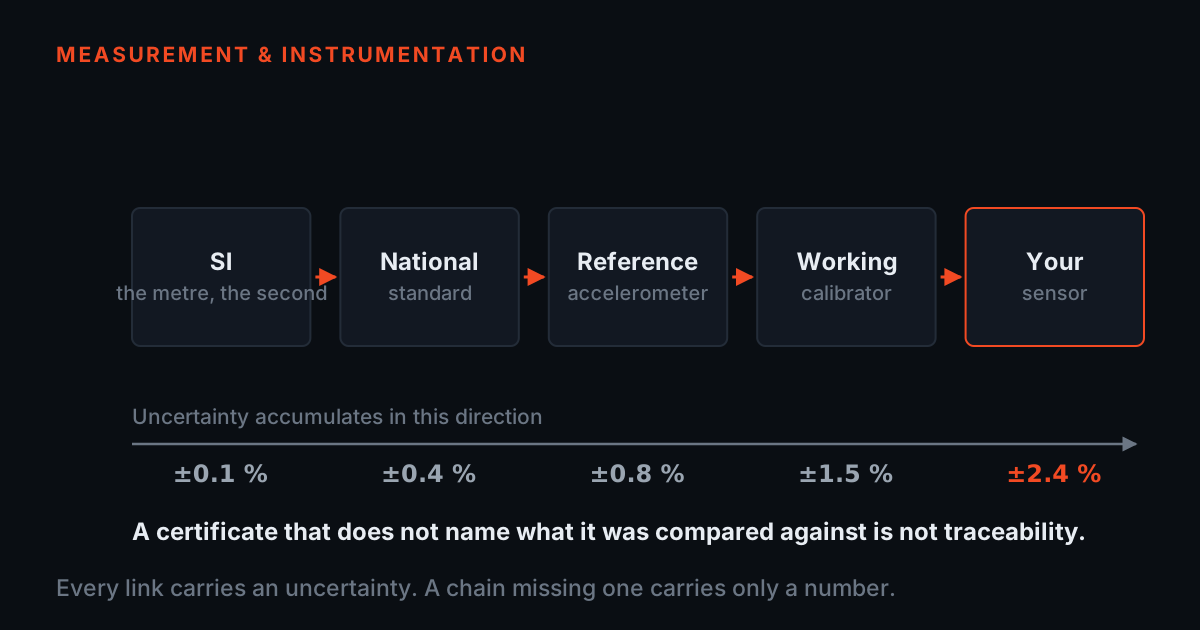
- A comparison only proves as much as the reference is worth, which is what traceability is for: an unbroken chain of documented comparisons back to a national measurement standard.
The fix is a comparison, not faith. In back-to-back calibration, a reference accelerometer of known sensitivity and the sensor under test are mounted on the same vibrating surface, so both experience identical motion. The ratio of their outputs directly yields the test sensor's sensitivity — no anechoic chamber, no absolute measurement of motion needed. This is exactly what the TIERA T-Calibro does on the bench, exciting both sensors at 159.2 Hz — that is 1000 rad/s (1000 ÷ 2π = 159.155 Hz), a conventional reference frequency for comparison calibration under the ISO 16063 method family — and logging each run — date, operator, conditions, before and after sensitivity — into a certificate its software generates.
But a comparison only proves as much as the reference is worth, which is where traceability comes in: an unbroken chain of comparisons linking your reading back to a national measurement standard. T-Calibro's reference sensor ships with a factory calibration certificate establishing its sensitivity against a national-standard traceable chain. Whoever calibrates your sensors, ask for the same evidence: a certificate for their reference, the traceability chain behind it, and the measurement uncertainty — an accreditation logo on a brochure is not the same as a traceable certificate for the actual reference used on your sensor.
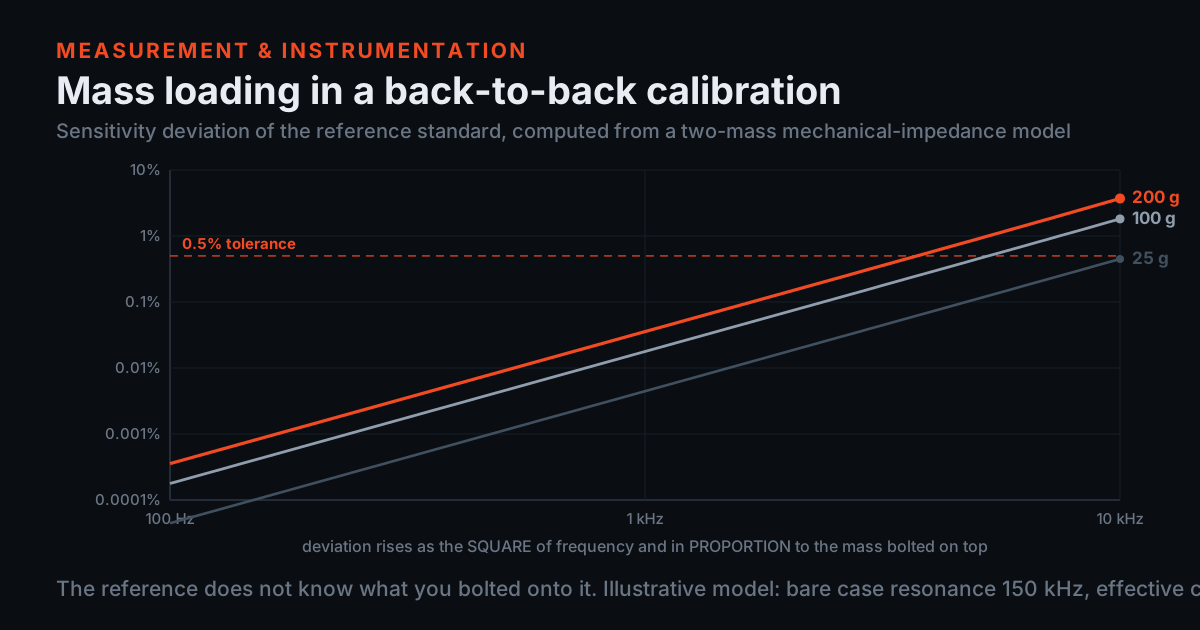
Two questions sit underneath that chain and this post takes both as given: where the chain terminates at the top, in an absolute (reciprocity) calibration that needs no reference sensor at all, and the mass-loading error that quietly biases every back-to-back comparison hanging below it. /blog/reciprocity-calibration-and-mass-loading takes both apart, and shows why a single-point check at the reference frequency is almost immune to the second one.
Run the check yourself: measured against expected
- A calibration verdict is one comparison: what the sensor actually reads against what you expected it to read. Every input that changes the reading has to change the verdict, or the check proves nothing.
- A result that lands inside the reference's own uncertainty band has not passed and has not failed — it is inconclusive, and a reference too coarse for your tolerance can never produce a pass at all.
Here is the check as arithmetic you can drive. The calibrator is rated at 1.000 g RMS at 159.2 Hz. Your sensor's certificate states a sensitivity. Multiply the level the table actually delivers by the sensitivity the sensor actually has, and you get the millivolts the analyser will read. Divide that by what you expected — the rated level times the stated sensitivity — and the difference is your error.
That framing matters more than it looks, because the common way to get this wrong is to compute the error from the sensitivity alone. Do that and a shaker delivering 1.20 g against a 100 mV/g sensor reports a reading of 120 mV, a 20 percent error, and a verdict of zero percent — passed. Drag the shaker slider here and the verdict moves, because the error term is measured against expected and the shaker level is part of the measurement.
The uncertainty slider is the other half. Every reference carries its own uncertainty, and it sets a band around your result that you cannot see inside. If the band still fits entirely within your tolerance, you have proven conformity. If it falls entirely outside, you have proven non-conformity. If it straddles the limit, you have proven nothing — the honest verdict is inconclusive, and the fix is a better reference, not a more optimistic reading of the same one.
Calibrator rated 1.000 g RMS at 159.2 Hz (1000 rad/s ÷ 2π = 159.155 Hz). Levels and readings are both RMS: 1.000 g RMS is 1.414 g peak (× √2), and sensitivity is a ratio, so it is the same number either way — but only if the level and the reading use the same convention. Conformity is decided by guard-banding the tolerance with the reference's expanded uncertainty, the ISO 14253-1 / ILAC-G8 rule.
How often to re-verify — and a worked scenario
A common baseline is a yearly cycle — TIERA's own PhonoVibe DAQs ship with a factory calibration certificate carrying one year of validity — plus an event-driven check any time a sensor is dropped, over-ranged, runs hot, or simply starts disagreeing with its neighbours. With a bench calibrator in-house, a five-minute sensitivity check before a critical survey costs almost nothing; the drift chart earlier shows why the between-checks gap is where trouble hides.
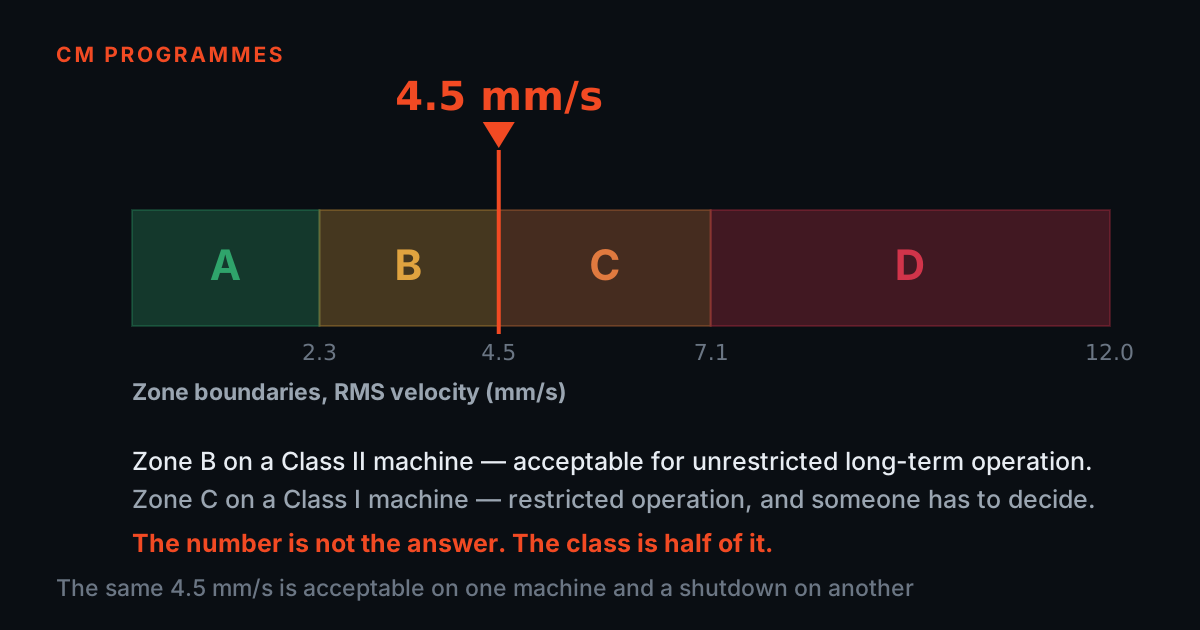
A representative scenario, not a specific customer: a reliability team trends a fan bearing monthly at around 3.9 mm/s, just under their 4.5 mm/s alert. The route sensor is dropped on a walkway; nobody logs it. The next three surveys read about 3.4 mm/s — the team sees improvement while the bearing is actually degrading. A routine back-to-back check finally shows the sensor reading about 30 percent low; corrected, the trend was above the alert line for two months. Nothing in the data looked wrong — only the comparison against a reference exposed it.
- Run a yearly cycle, and add an event-driven check whenever a sensor is dropped, over-ranged or runs hot
- Re-check a sensor that starts disagreeing with its neighbours
- Take the five-minute bench check before a critical survey, while it still costs almost nothing
- Log every check — date, operator, conditions, sensitivity before and after
- Read a clean, confident-looking waveform as evidence of a healthy sensor
- Wait for the annual cycle after a knock nobody wrote down
- Treat a downward trend as improvement without comparing the sensor against a reference
- Trust a sensitivity that has never been compared against anything
Where to learn the full chain
If this explainer raised more questions than it answered, that is the right instinct. TIERA publishes free primers at 101.tieraonline.in — Accelerometer & DAQ Selection 101 covers how IEPE sensors, sensitivity, and acquisition actually work, and Measurement Setup 101 covers mounting, cabling, and configuration. TIERA 101 is a free primer series, not an accredited certification.
For teams that need formal, examined competence, TIERA's TCAT programme (see /services) builds from these fundamentals to full measurement practice, with proctored examinations conducted at exams.tieraonline.in. And if you want the comparison workflow on your own bench, the T-Calibro product page describes the back-to-back system and its record-keeping software in detail.
TIERA instruments that do this work.

T-Calibro Vibration Calibration System
The bench instrument this post describes — a documented back-to-back comparison that puts a verified sensitivity behind every number you report.
- Method
- Back-to-back comparison calibration
- Calibration frequency
- 159.2 Hz (≈1000 rad/s), per ISO 16063 back-to-back convention
- Compatibility
- All IEPE / ICP accelerometers
- Software
- Automated calibration records and one-click certificate export
- Certificate
- Factory calibration certificate included with the unit

Sensors & Accessories
A verified sensitivity is wasted if the cable or mount spoils the signal on its way to the DAQ — this is the hardware that protects the rest of the chain.
- Cables
- Low-noise coaxial (CA-101) against triboelectric noise; armored SS outer (CA-103) near moving machinery — 5 m standard
- Mounting
- SS304 triaxial block, magnetic mount, adhesive pad set
- Accelerometers
- TACPB-10T3 uniaxial MEMS IEPE, plus industrial, compact and low-frequency variants
- Routing
- Vibration junction boxes for multi-point tests

PhonoVibe Series — Sound & Vibration DAQ
The DAQ is a link in the traceability chain too — every PhonoVibe ships with its own factory calibration certificate on a yearly cycle.
- ADC
- 24-bit across the entire series
- Calibration
- Factory calibration certificate, 1-year validity
- Sensor power
- IEPE / ICP / CCLD — 24 V, 4 mA constant current
- TEDS
- Supported — the DAQ reads the sensor's own identity
From the TIERA store
The kit for this job
What we would actually put in front of someone doing the measurement this post describes — not the whole catalogue.
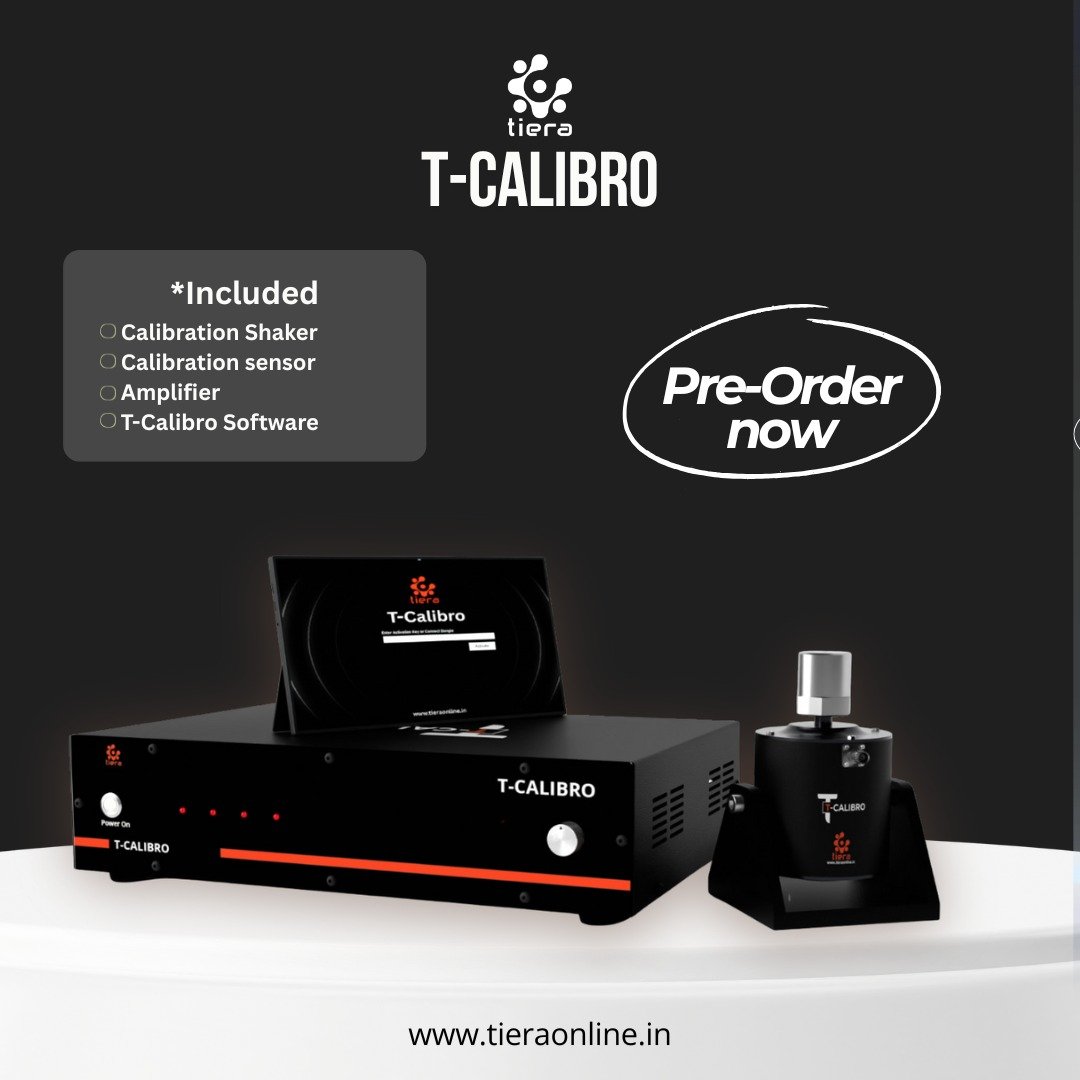 T-Calibro _ Precision Sensor Calibration Device for Accelerometers & Vibration SensorsT-Calibro is a high-performance PC-based vibration calibrator designed to calibrate and verify the working conditions of accelerometers, velocity sensors, and vibration meters. It provides stable, traceable vibration signals and supports IEPE, charge and voltage-type sensors, ensuring complete flexibility for industrial, laboratory, and R&D environments.₹18,00,000View →
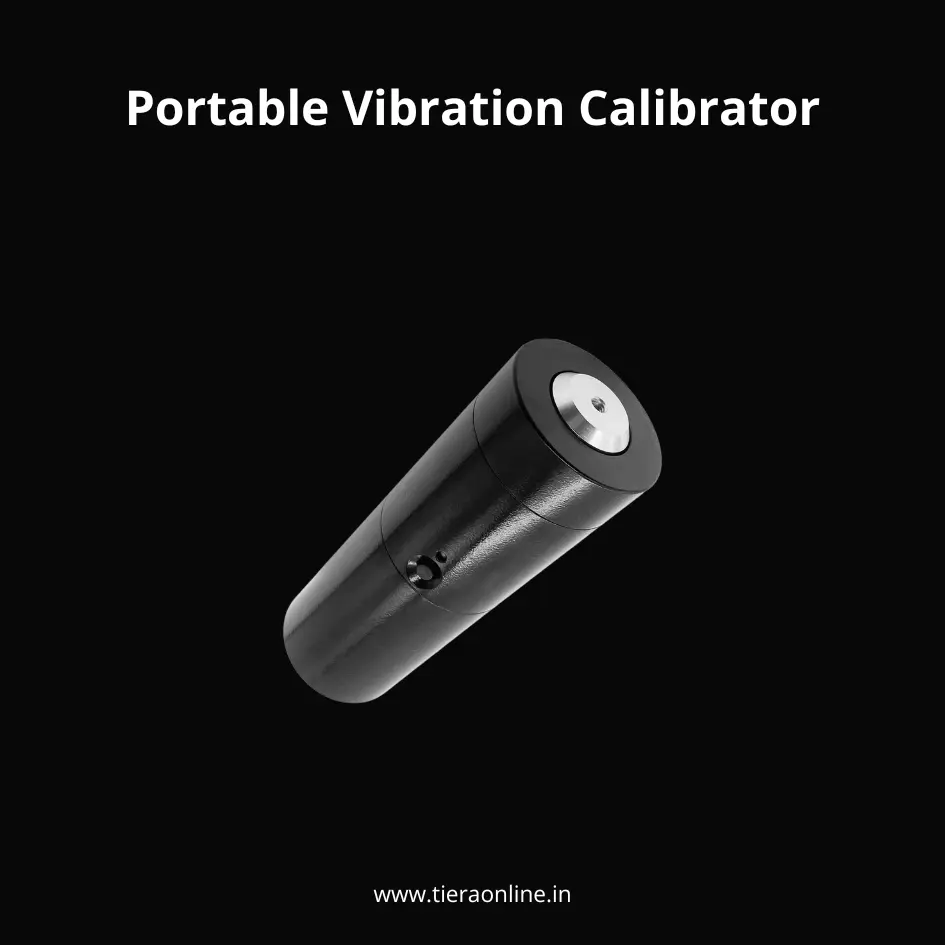 VC 01- Portable Vibration CalibratorVibration Calibrator Rapid judgement of measurement system integrity. Rapid measurement of the Sensitivity of the Acceleration/ Velocity/Displacement sensors. Battery powered with automatic shutdown. Self-contained vibration reference. Small size. Light weight₹1,41,000View →
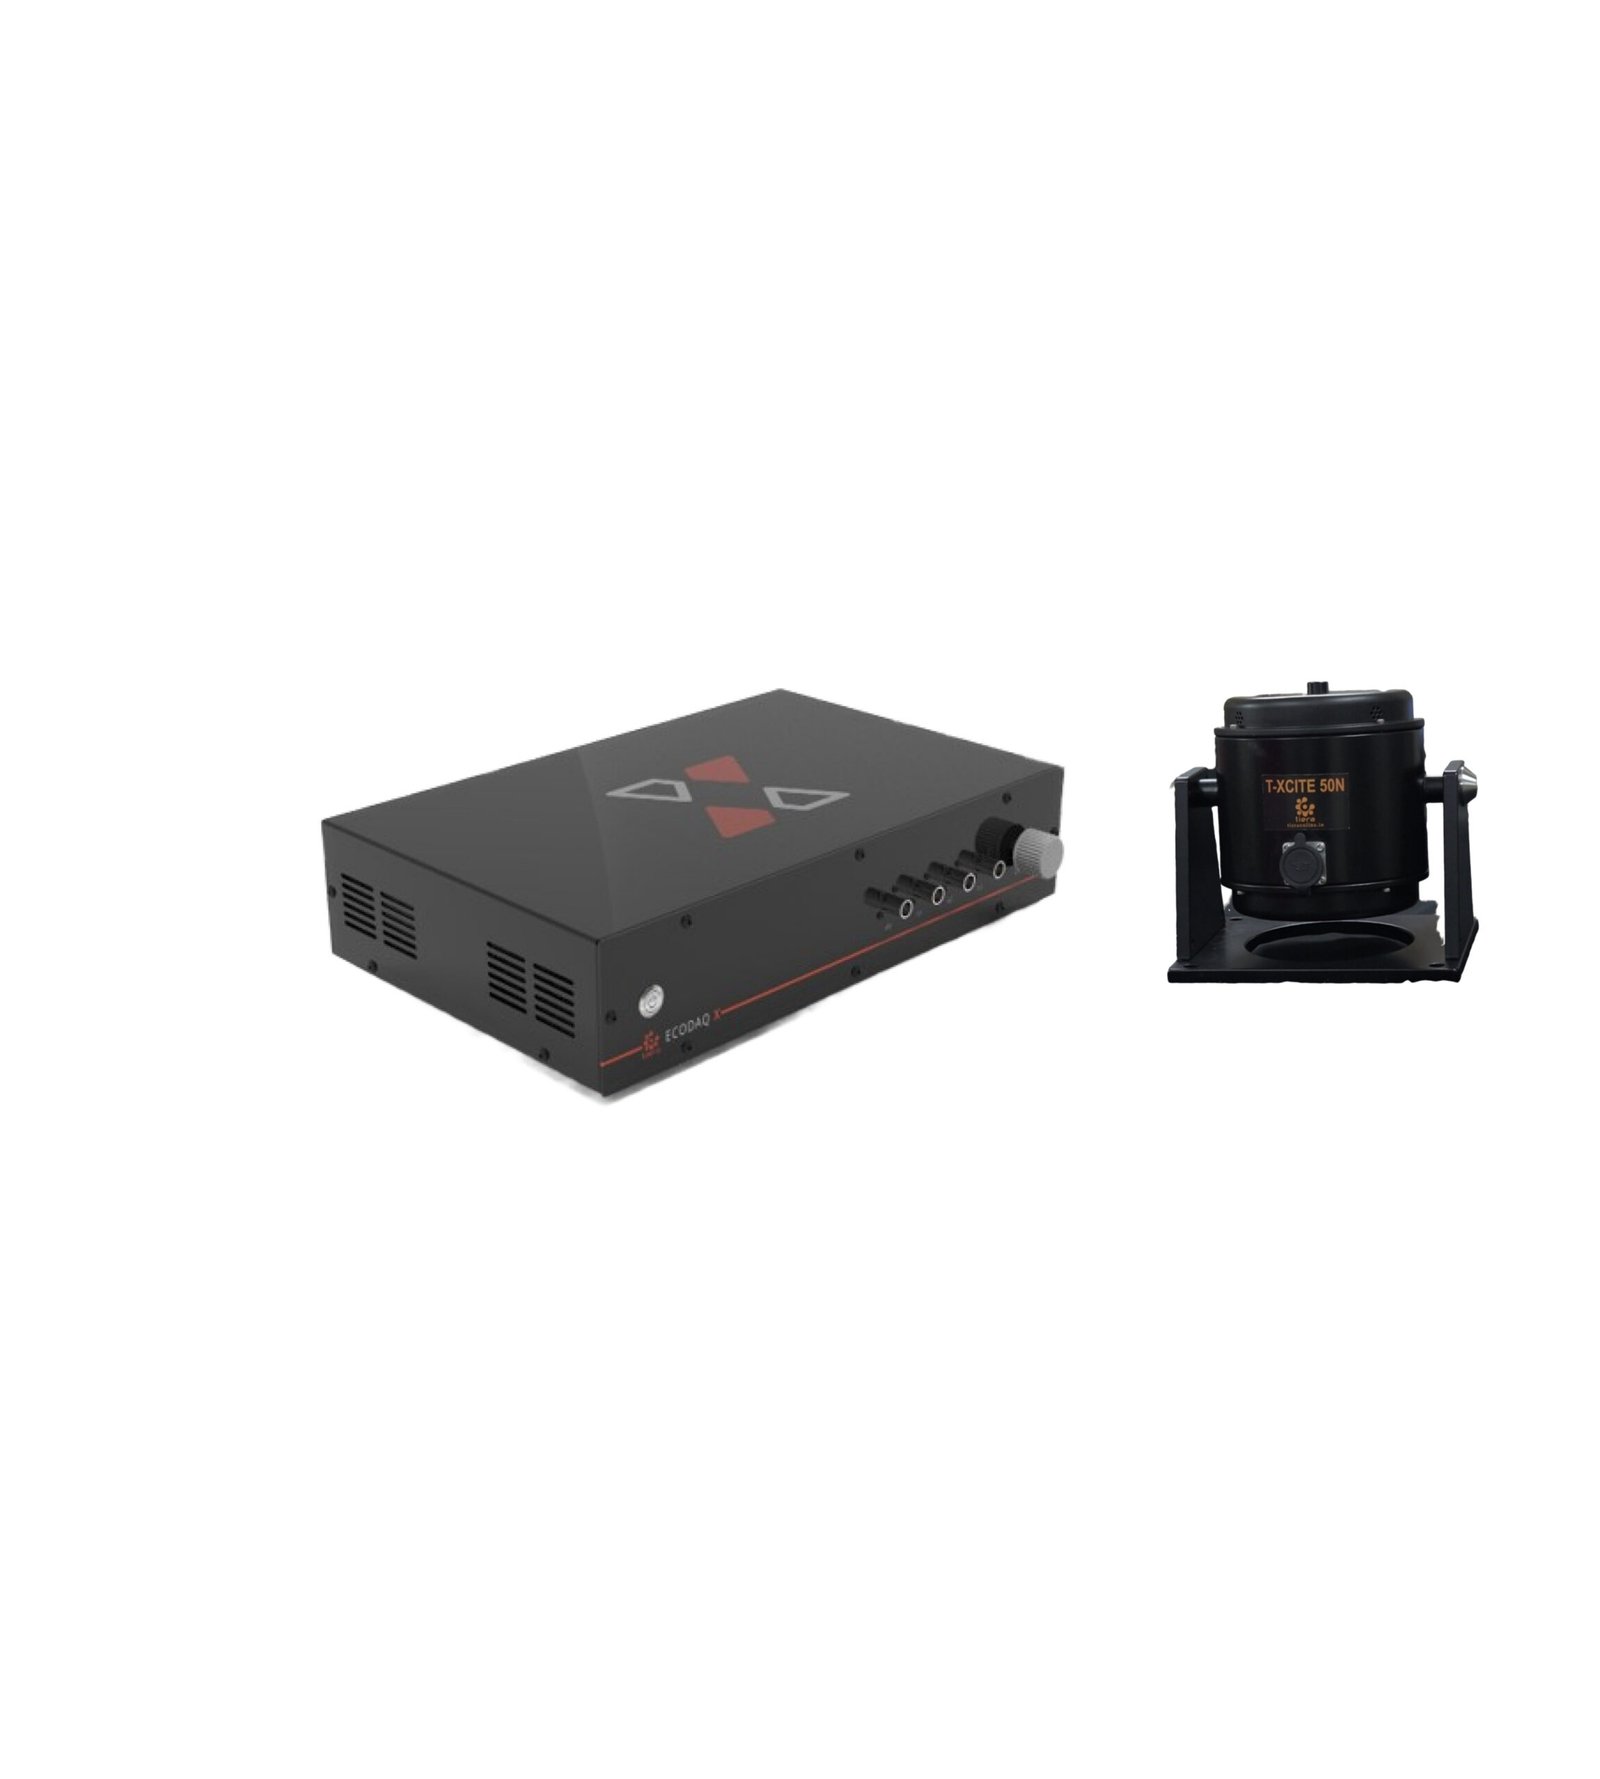 TXcite 50 – Electrodynamic Shaker (50 N) with AmplifierT-Xcite Permanent magnet modal shakers provide precise, reliable, stable and long-lasting operation. Highest quality materials, stringent quality control and rugged construction General mechanical mobility measurements Experimental modal analysis on most mechanical structures SISO, MISO. SIMO and MIMO modal test applications Advanced structural dynamics investigations Structural damage detection Finite element model correlation₹4,80,000View →
Use cases
Where this shows up in the field
Put a verified sensitivity behind every number you report
The comparison this post describes is a bench instrument, not a metrology lab. The T-Calibro mounts a reference accelerometer and your sensor on the same vibrating surface at 159.2 Hz (1000 rad/s) — a conventional reference frequency for back-to-back comparison under the ISO 16063 method family — and its software logs every run (date, operator, conditions, before and after sensitivity) and exports the certificate. Its reference sensor ships with a factory calibration certificate establishing its sensitivity against a national-standard traceable chain: the same evidence this post just told you to demand from anyone who calibrates your sensors.
The rest of the chain matters too. Every PhonoVibe DAQ ships with its own factory calibration certificate carrying one year of validity, and TIERA stocks the cabling and mounting hardware that stops a good sensitivity being spoiled on the way to the DAQ — low-noise coaxial cable against triboelectric noise, armored cable for runs near moving machinery, and stud, triaxial, and magnetic mounts.
- T-Calibro — back-to-back comparison calibration for IEPE/ICP accelerometers, with automated calibration records and one-click certificate export
- Reference sensor supplied with a factory calibration certificate traceable to a national-standard chain
- PhonoVibe DAQs — 24-bit capture, each shipping with a factory calibration certificate (1-year validity)
- Low-noise and armored IEPE cables, SS304 triaxial blocks, magnetic mounts, and adhesive pads to protect the rest of the chain
Where this sits on the TIERA learning ladder.
The theory behind this article is covered free, in full, by the TIERA 101 primers: Accelerometer & DAQ Selection 101, Measurement Setup 101. They are self-paced, interactive, and end in an exam and a certificate.
TCAT adds instructor-led depth on calibration practice and measurement uncertainty, with proctored exams that certify competence — the free primers explain; TCAT verifies.
TIERA 101 is a free introductory primer, not an accredited ISO certification, and its hours do not count towards the formal training ISO 18436 requires.