Set the Alarm Too Tight and Nobody Listens: Choosing Thresholds You Can Live With
Every alert and alarm line is a bet between wasted trips and lost warning time — there is no perfect threshold, only one your team can live with. A mini explainer plus a live trainer: drag the lines, count the false alarms, watch the warning window shrink, and see what a simple consecutive-readings rule buys.
Every threshold is a bet, not a truth
- One line controls both losses, so no setting avoids both. The real question is economic: what does a wasted trip cost you, against what a lost week of planning time costs you?
- A plant with a standby pump and a technician on site can afford a tight, chatty alert. A plant whose spare is eight weeks away by sea cannot afford a loose one.
An alarm limit looks like an engineering constant, but it is really a wager with two ways to lose. Set the line tight and it fires on scatter: each false call-out sends a technician to a healthy machine, and each wasted trip spends a little of the team's trust, until flags get acknowledged without being investigated and the one alert that mattered dies in a full inbox. Set the line loose and the panel stays reassuringly quiet — while the weeks of warning a growing fault would have given you quietly drain away, and a planned bearing change turns into a forced outage.
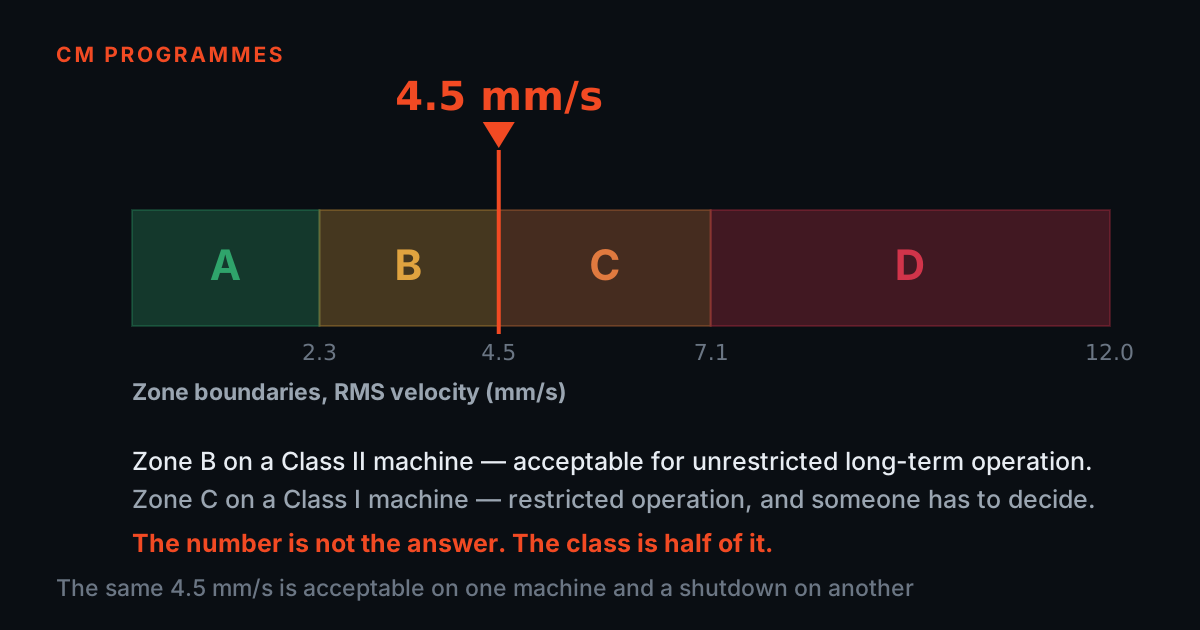
There is no threshold that avoids both, because the same line controls both. The choice is an economic one: what does a wasted trip cost you, and what does a lost week of planning time cost you? A plant with a standby pump and a technician on site can afford a tight, chatty alert; a plant whose spare is eight weeks away by sea cannot afford a loose one. That is why the severity chart on the wall is a backstop, not an answer — our earlier post on starting a programme (/blog/starting-a-cm-programme) argued that alarm limits come last, after you know the machine's normal. This post is about what to do when you get there.
What an 18-month trend actually gives you to work with
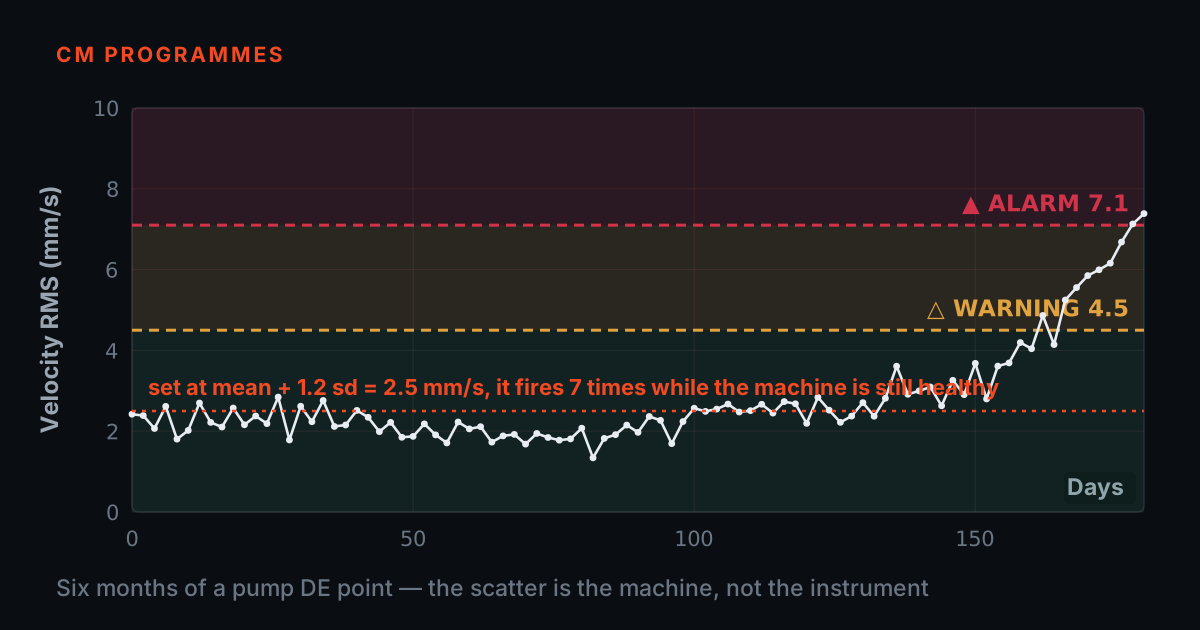
A real overall-vibration trend is three signals braided together. First, scatter: temperature, load, exact sensor seating, and which technician walked the route all nudge the number, so a healthy machine never plots a flat line. Second, harmless steps: a VFD speed raise or a duty-point change shifts the whole trend up and keeps it there — the machine is fine, but its normal has moved. Third, and only occasionally, a genuine fault: a rise that does not step and settle but grows, slowly at first, then accelerating as damage feeds on itself. All the numbers in this post's figures and simulator are illustrative, but the anatomy is what route data really looks like.
The classic failure mode is a threshold set once, against the commissioning baseline, and never revisited. A year later a load step eats the margin between normal and the line, and the alert starts chattering. Someone — reasonably — raises the threshold 'to stop the noise', usually without asking why the level moved. Now the line sits far above the new normal, and the machine has to deteriorate a long way before anyone hears about it. The discipline that prevents this is cheap: when you know the operating point changed, re-baseline and re-set the bands, rather than letting the threshold absorb the step as slack.
Try it: set thresholds you can live with
Below is a synthetic machine: about eighteen months of weekly overall-velocity readings, with realistic scatter, one harmless load step, the odd one-off spike, and one genuine fault that begins late in the run and grows until the end — which is the machine's end of useful life. Drag the ALERT and ALARM lines directly on the chart (or use the sliders), and the counters keep score live: how many times each line would have sent someone to a healthy machine, and how many weeks of warning your settings would have bought once the real fault arrived.
Try it in this order. Start with the alert at 3.0 mm/s and 'act on any crossing', and count the wasted trips. Loosen the line until the false call-outs stop — then look at what happened to the warning time. Now put the line back down and switch the rule to 'require 3 in a row' instead. Finally, press reshuffle: the same thresholds against a new run of data is the honest test, because the real machine will not replay the trend you tuned on.
Drag a threshold line on the chart, or use the sliders.
Synthetic, illustrative data: ~18 months of weekly overall-velocity readings with normal scatter, one harmless load/speed step, occasional one-off spikes, and one genuine fault that grows late in the run. The dashed orange marker shows where the fault really begins — information you never have on a live machine. The run ends at the machine's end of useful life, so warning time is how many weeks of notice your settings would have bought.
The consecutive-readings rule buys most of the benefit
- One crossing is weather; several in a row is climate. A bumped sensor is gone by the next reading; damage does not un-grow.
- The price is at least N−1 readings of delay — at least, because an early fault that dips back under the line between readings resets the count.
One crossing is weather; several in a row is climate. A one-off spike — a poorly seated magnet, a passing transient, a technician bumping the sensor — crosses the line once and is gone by the next reading. A genuine fault crosses the line and stays there, because damage does not un-grow. Requiring two or three consecutive readings above the threshold before anyone gets called filters out almost everything that made the tight setting unbearable, at a price you can reason about: the alert arrives at least N−1 readings later — at least, not exactly, because an early fault that still dips back under the line between readings resets the count and can add a few more. In the simulator you can watch this directly — the rule usually removes most of the false call-outs while giving back a few readings of warning.
That price is why measurement cadence is part of the alarm design, not a separate decision. Three-in-a-row costs two weeks on a weekly route but two months on a monthly one — on a sparse route, a persistence rule can quietly spend the very warning time it was meant to protect. The same idea has fancier relatives: N-of-M voting, time-above-threshold, and band alarms that watch specific frequency regions rather than the overall level — in TVIB, band cursors let you set alarm bands around bearing defect and gear-mesh frequencies, and the NDT RAM module applies the same spectral-envelope logic to production pass/fail testing. But the plain consecutive-readings rule is where to start, because everyone on the team can understand exactly why the alarm did or did not fire.
Where to put the lines when you have a baseline
- Alert and alarm are different instructions, not two heights of the same one. Alert means plan — confirm the trend, schedule the spectrum, order the bearing. Alarm means act at the next real opportunity.
- The recipe assumes the baseline is roughly normal and stationary. A load step moves the mean, so a two-sigma line stops being a two-sigma line the moment the operating point changes.
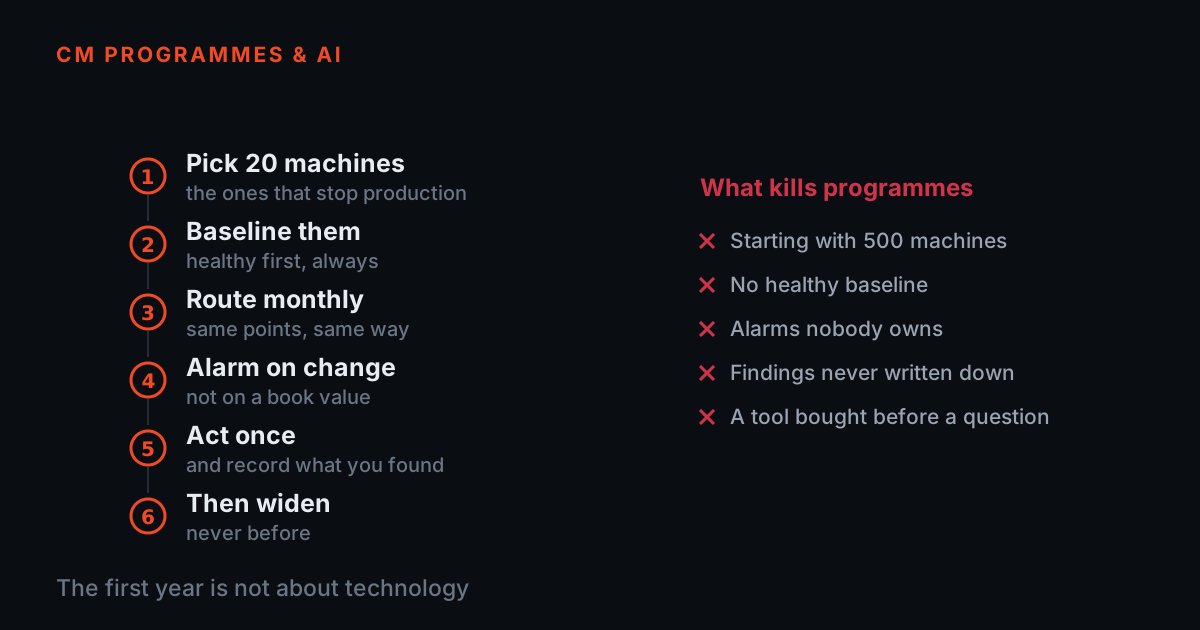
With half a dozen route visits banked, you know two numbers for each point: the machine's normal level and its normal scatter. A widely used starting recipe — illustrative, and always machine-specific in practice — is to set the ALERT line a couple of standard deviations above the machine's own baseline mean, and the ALARM line as the backstop where experience or the severity standard says damage is genuinely likely. The two lines then mean different things: alert means plan — confirm the trend, schedule the spectrum, order the bearing; alarm means act — intervene at the next real opportunity. A threshold derived from the machine's own scatter will beat a generic chart value for both false-alarm rate and warning time, because it is fitted to the noise it has to live above.
That recipe carries an assumption worth saying out loud, because nobody ever does: it treats the baseline as approximately normal and stationary — the same mean and the same scatter, reading after reading. Grant that, and the false-crossing rate is not a matter of taste. A one-sided line at two standard deviations is crossed by 2.3 per cent of healthy readings, about one in forty-four, so on a weekly route a single point throws a spurious crossing roughly once every ten months. Three standard deviations is 0.13 per cent, about one in seven hundred and forty — once every fourteen years on that same point. Neither number sounds like anything until you multiply it by the route: two hundred points at two sigma is four or five false crossings every week, which is exactly the inbox this post opened with, and it is why the first thing to reach for is a persistence rule rather than a tighter line. And note what breaks the assumption — the harmless load step in the figure above moves the mean, so a line set at two sigma stops being a two-sigma line the moment the operating point changes, which is the whole argument for re-baselining rather than letting the threshold absorb the step.
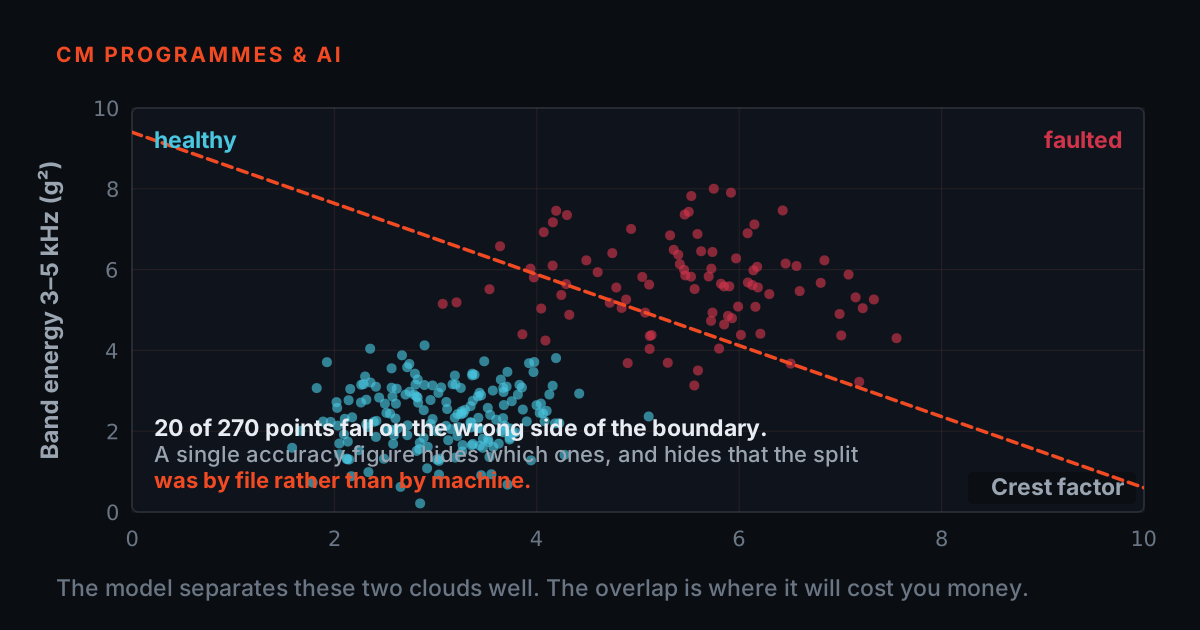
Then govern the lines like the instruments they are. Every alert gets a response — even if the response is a documented 'checked, operating change, re-baselined'. If an alert fires repeatedly and nothing is ever done, fix either the machine or the threshold; silencing the alert while changing nothing is how programmes rot. Review the bands on a calendar, re-set them after any known operating change, and log every change with a reason. And if your programme feeds an anomaly-detection model instead of a fixed line, nothing above changes — a score threshold is still a threshold, and our post on what AI can and cannot tell you (/blog/ai-anomaly-detection-limits) walks the same trade-off from that side.
- Derive each line from that machine's own baseline mean and scatter.
- Re-baseline and re-set the bands whenever you know the operating point changed.
- Give every alert a response, even if the response is a documented 'checked, operating change, re-baselined'.
- Log every threshold change with the reason for it, and review the bands on a calendar.
- Set every point at the generic chart value on day one and wait for the inbox.
- Raise a chattering threshold without first asking why the level moved.
- Let a threshold absorb a load step as slack.
- Silence an alert that fires repeatedly while changing nothing on the machine or the line.
A representative programme — and the skills underneath
A representative programme, not a specific customer: a plant sets alert lines tight on day one — everything at the chart value, any crossing flagged. Within two months the reliability inbox is noise, and the team is walking to healthy machines several times a week. Instead of loosening everything, they re-derive each line from six visits of baseline data, add a two-consecutive-readings rule at their fortnightly cadence, and log one line per machine explaining where the number came from. The call-outs drop to a level people actually answer. When a genuine bearing fault develops the following year, the alert fires on two successive visits, the spectrum confirms it, and the change-out happens on a planned weekend — with the warning window doing exactly what it was set up to buy. No heroics, no perfect threshold: just lines the team could live with, tested against data they had not seen.
The judgement in that story — knowing scatter from growth, knowing when to re-baseline, keeping the measurement repeatable enough that the threshold means anything — is a skill, and it can be built deliberately. The free TIERA 101 primers at 101.tieraonline.in cover the ground under this post: Measurement Setup 101 for the repeatable data a threshold depends on, and AI Condition Monitoring 101 for the same alarm economics applied to anomaly scores. They are free primers, not accredited ISO certification. For a credentialed analyst there is the formal TCAT programme, detailed on our services page, with proctored examinations at exams.tieraonline.in — and To-Learn Vibe drills the diagnosis side on 100+ simulated fault scenarios once the alert has done its job of making someone look.
TIERA instruments that do this work.

PhonoVibe Series — Sound & Vibration DAQ
A threshold only means something on a repeatable trend: 24-bit simultaneously sampled route data with a factory calibration certificate, so a change in the trend means the machine changed — not the instrument.
- ADC resolution
- 24-bit, simultaneous sampling
- Channels
- 2, 4, 8 or 16 (BNC)
- Sensor power
- 24 V, 4 mA (IEPE/ICP/CCLD)
- Calibration
- Factory certificate, 1-year validity
- Warranty
- 2 years standard, extendable to 3

TVIB — Sound & Vibration Analysis Software
Where the alert and alarm lines actually live: trending with band cursors around the frequencies that matter, so rising bearing-band energy flags trouble while the overall level still looks respectable.
- Base module
- TSAP201 — free with every PhonoVibe
- FFT size
- Up to 102,400 points
- Cursors
- Harmonic, band and sideband, in time and frequency
- Averaging
- Exponential, linear, peak hold
- Spectral alarm
- NDT RAM module — pass/fail alarm envelopes

Sensors & Accessories
Baseline scatter starts at the mounting: a fixed SS304 block or a repeatable magnetic mount on the same spot each visit keeps the scatter about the machine, not the fixture.
- Permanent mount
- TMB-101-1-A SS304 triaxial block
- Route mount
- TMA-101-1 magnetic mount
- Non-magnetic surfaces
- TAP-101-1A adhesive pad set
- Cabling
- CA-101 low-noise coaxial; CA-103 armored SS outer
From the TIERA store
The kit for this job
What we would actually put in front of someone doing the measurement this post describes — not the whole catalogue.
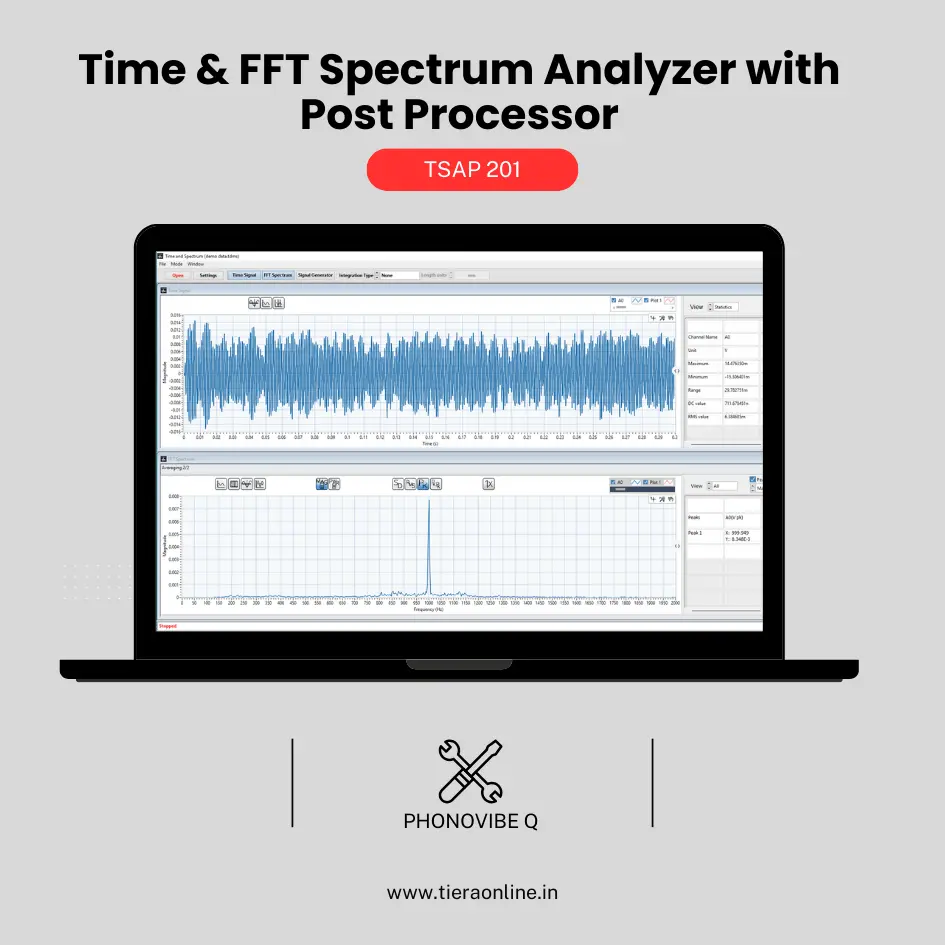 TSAP 201 -Time & FFT Spectrum Analyzer with Post Processor (Phonovibe Q)Use Cases Bump Test Product Development Off route Machine Vibration analysis. Drop Test Product Development & Research₹34,560View →
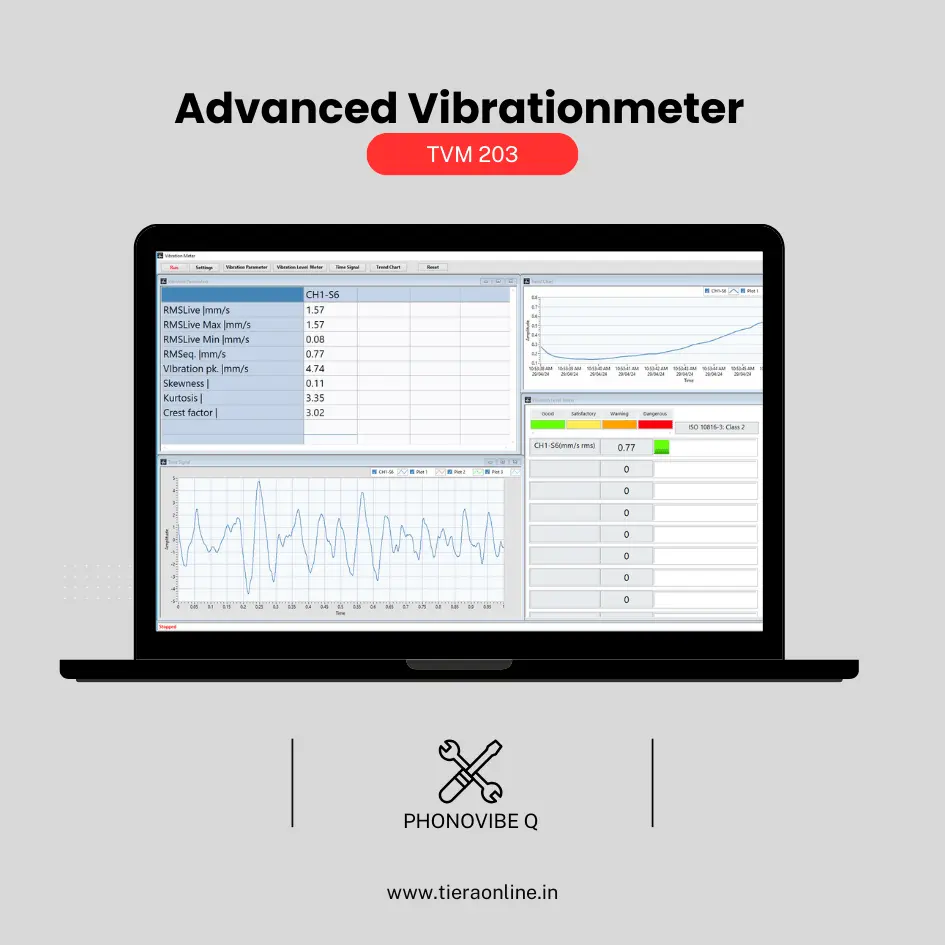 TVM 203 -Advanced Vibrationmeter (Phonovibe Q)Use Cases Off route Machine Vibration analysis Product Development & Research₹41,472View →
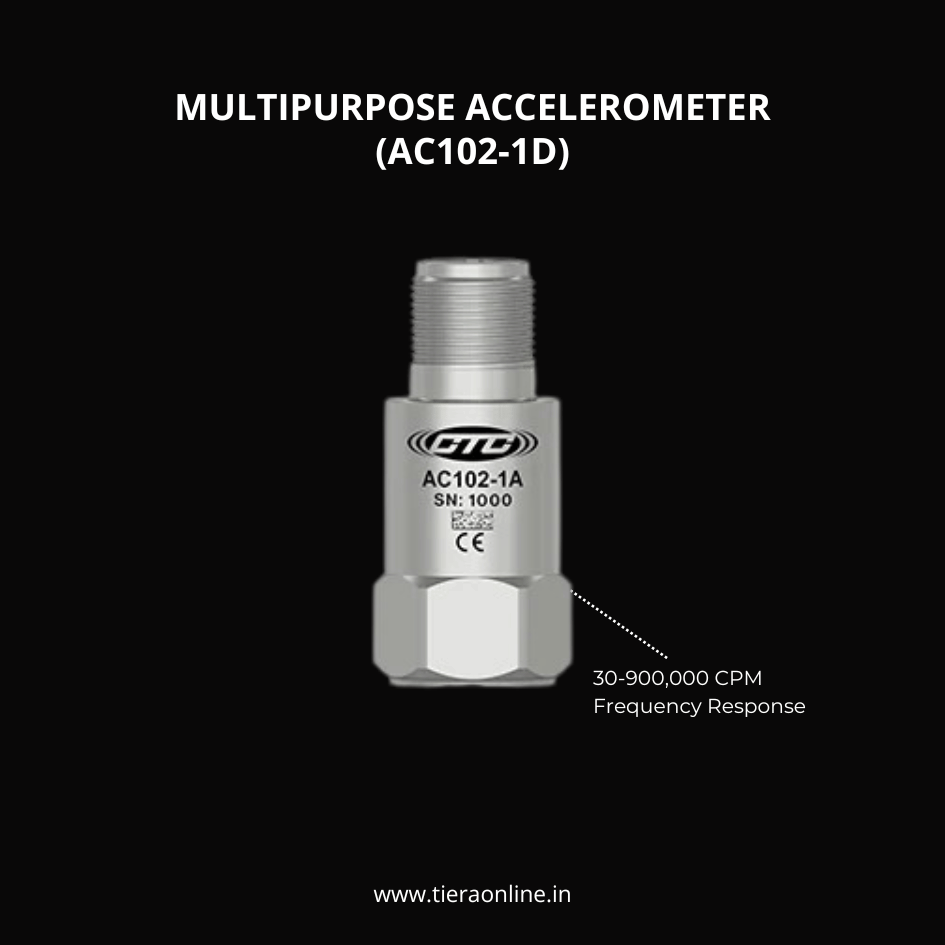 AC102-1D, MULTIPURPOSE ACCELEROMETERMULTIPURPOSE ACCELEROMETER, TOP EXIT 2 PIN CONNECTOR, 100 MV/G, ±10% 30-900,000 CPM Frequency Response (±3dB) -58 to 250 °F (-50 to 121 °C) Temperature Range Welded, Hermetic Sealing CTC’s Best Selling, Multi-Purpose Sensor Ideally Suited for Thousands of Applications₹14,750View →
Use cases
Where this shows up in the field
Alarm bands set from your machine's own baseline — not a chart on the wall
Everything in this post assumes one thing: a trend repeatable enough that a threshold on it means something. That is what the TIERA measurement chain is for. A PhonoVibe DAQ gives you 24-bit, simultaneously sampled route data with IEPE sensor power and a factory calibration certificate (1-year validity), so a change in the trend means the machine changed — not the instrument. TVIB's TSAP201 base module, bundled free with every PhonoVibe, handles the time waveform, spectrum, and trending; its band cursors put alarm bands around the frequencies that matter, so rising bearing-band energy flags trouble while the overall level still looks respectable.
If you are setting bands for the first time, talk to us. We will not pretend there is a magic threshold — but a baseline survey, bands derived from your machines' own scatter, and a trigger rule matched to your route cadence is a workflow we can help you commission.
- PhonoVibe D/Q/O/HD — 24-bit USB DAQ, IEPE/ICP/CCLD power, TEDS, factory calibration certificate, from 2 to 16 channels
- TVIB TSAP201 (bundled) — trending, narrowband FFT to 102,400 points, harmonic/band/sideband cursors for frequency-band alarms
- Baseline-to-bands commissioning: we help you turn your first six route visits into alert and alarm settings your team can live with
Where this sits on the TIERA learning ladder.
The theory behind this article is covered free, in full, by the TIERA 101 primers: Measurement Setup 101, AI Condition Monitoring 101. They are self-paced, interactive, and end in an exam and a certificate.
The free primers teach the trade-off; TCAT (with proctored exams at exams.tieraonline.in) trains and certifies the analyst who owns the thresholds — and answers for them at the morning meeting.
TIERA 101 is a free introductory primer, not an accredited ISO certification, and its hours do not count towards the formal training ISO 18436 requires.