Sample Rate, Fmax and the Anti-Alias Filter: Getting the Front End Right
An alias is indistinguishable from a real fault once it is in the file. A visual walk through sampling, folding, Fmax, lines and the anti-alias filter — and how to pick a DAQ channel that cannot lie to you.
An alias is not noise — it is a perfect impostor
- Content above half the sample rate is not lost — it folds back and lands on a legitimate-looking frequency.
- The alias is sample-for-sample identical to a real tone there, so no post-processing can separate them.
- The information needed to tell them apart was destroyed at the instant of sampling, not later.
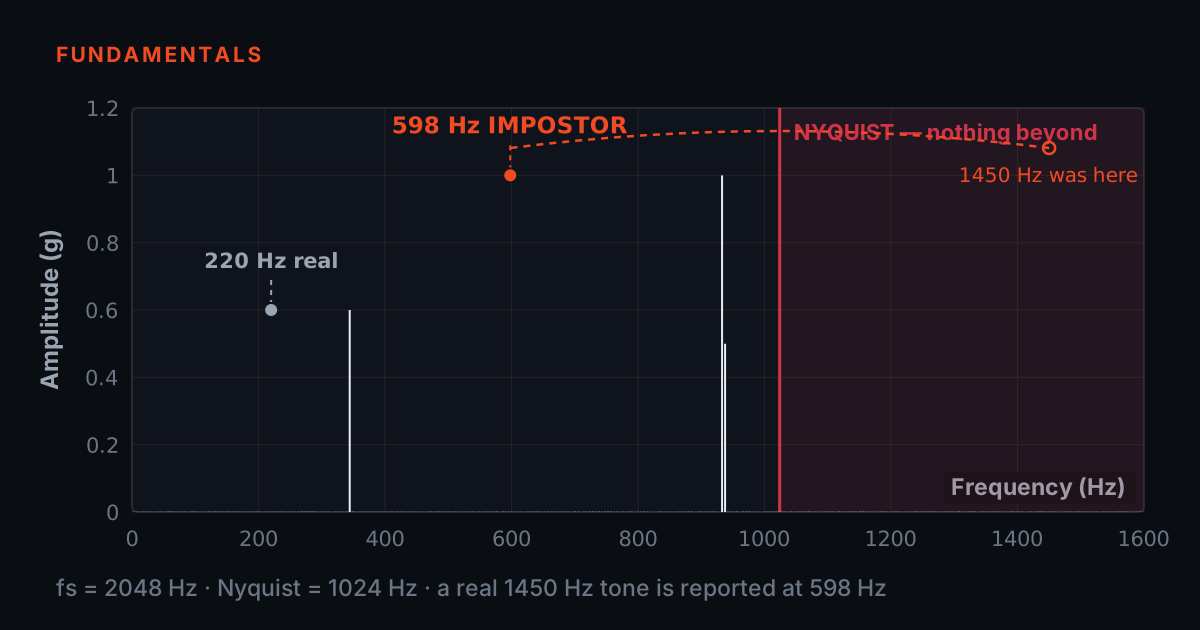
Most acquisition mistakes are recoverable: re-capture, re-route a cable, rescale the units. Aliasing is the exception. Any frequency content above half the sample rate does not disappear — it folds back into the measured band and lands on a legitimate-looking frequency. A 9 kHz component captured at 8 kS/s is stored as a clean, stable 1 kHz tone.
Once saved, the alias is sample-for-sample identical to a genuine tone at the folded frequency. No post-processing can separate them, because the information needed to tell them apart was destroyed at the instant of sampling. In condition-monitoring terms, an alias can fabricate a bearing tone — or sit on top of a real one and corrupt its amplitude.
The wagon-wheel effect, on your DAQ
A filmed wagon wheel appears to spin slowly backwards because the frame rate undersamples the spokes. Every frame is a true photograph, yet the motion you perceive never happened. Sampling a voltage does exactly the same thing.
Watch the dots below: every sample lies exactly on the true 9 kHz signal — the ADC never records a wrong value. But connect the samples, which is all an FFT can do, and they trace a perfect 1 kHz sine. This is why the theorem demands sampling above twice the highest frequency present at the input, not just the highest frequency you care about.
Fmax, lines and the resolution you actually get
- Fmax, line count and capture time are one setting wearing three names — fix any two and the third follows.
- Finer resolution is bought with longer capture and nothing else; no processing option shortens it.
- Sideband families need a resolution several times finer than the spacing, so they need seconds of steady data.
Three chained settings decide what a spectrum can show. Fmax is the highest displayed frequency; analysers conventionally sample at 2.56 times Fmax to leave room for a real anti-alias filter. The line count divides 0-to-Fmax into bins, so resolution is delta-f = Fmax divided by lines — and the capture time per average is T = lines divided by Fmax, which is exactly 1 over delta-f.
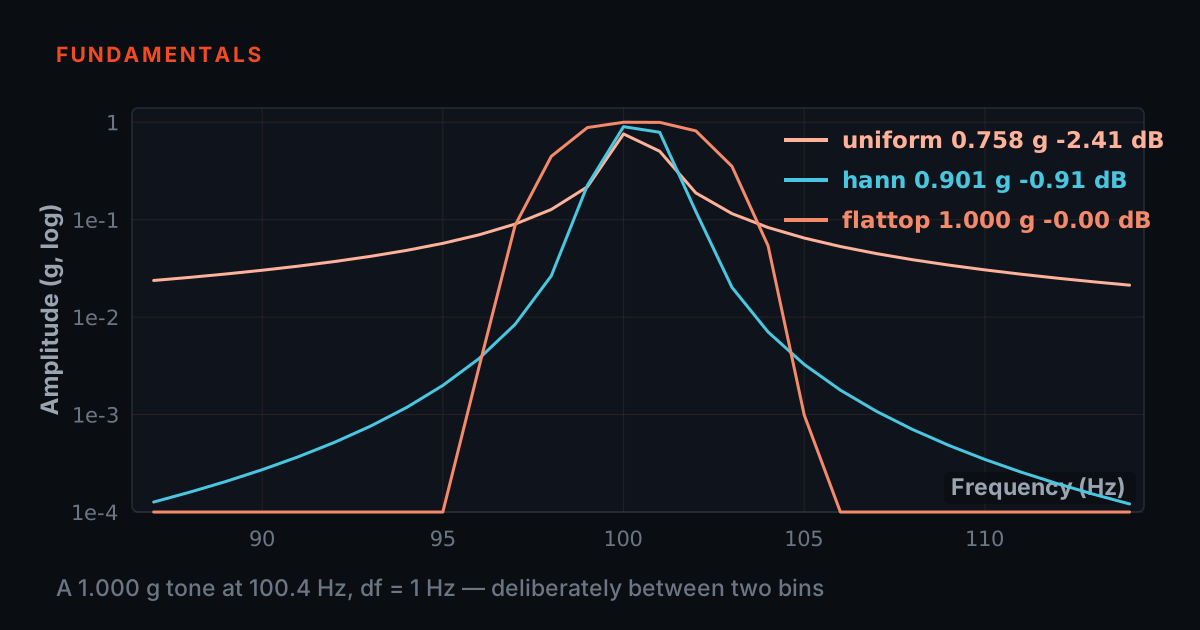
That identity is the whole trade-off: finer resolution is bought with longer capture, nothing else. Sideband families — gear mesh sidebands at shaft speed, rotor-bar spacing — need delta-f several times finer than the spacing, and therefore seconds of steady data. A wide survey capture and a fine zoom capture are different measurements; plan both.
The anti-alias filter: the mistake you cannot undo later
- The anti-alias filter has to be analogue and ahead of the ADC — a software filter deletes real in-band content and leaves the aliases untouched.
- No real filter is a brick wall, so an honest front end quotes bandwidth below Nyquist and leaves a guard band for the roll-off.
- A quoted bandwidth equal to half the sample rate is a datasheet to be suspicious of.
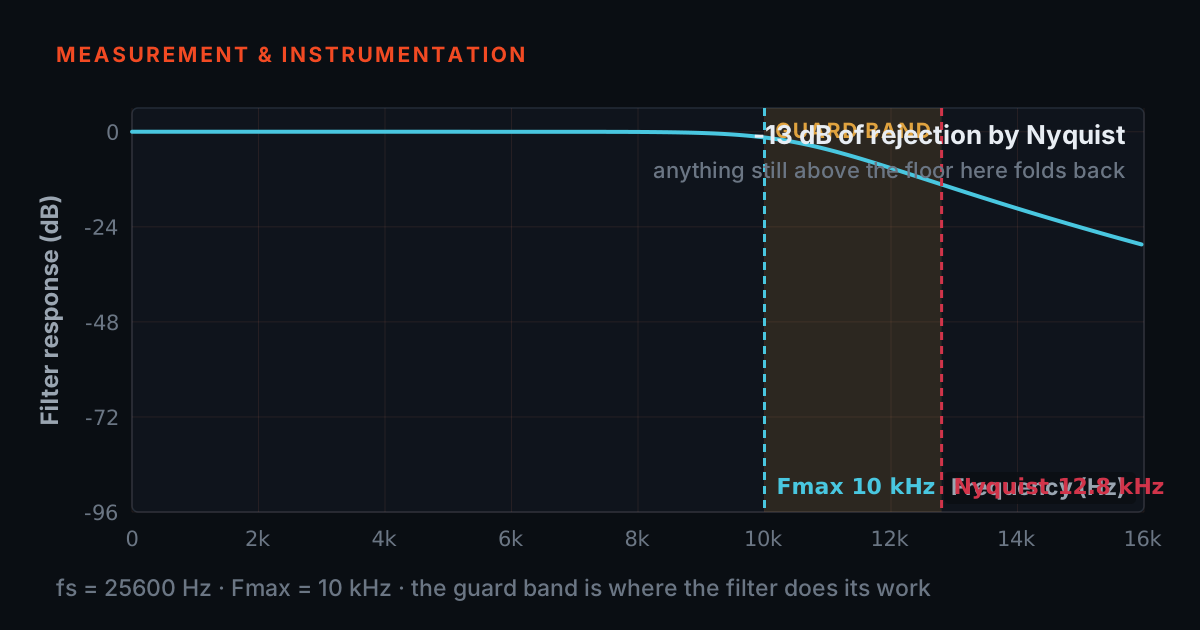
The only defence against aliasing is an analogue low-pass filter ahead of the ADC. It must exist in hardware: a filter applied in software afterwards can only delete real in-band content, while the aliases stay put, disguised as legitimate frequencies.
No real filter is a brick wall, so an honest front end never claims usable bandwidth all the way to Nyquist — there must be a guard band where the roll-off works. You can read this in the specifications: the PhonoVibe HD samples at 128 kHz per channel and quotes 0.5 Hz to 60 kHz of bandwidth, below the 64 kHz Nyquist limit; the 2-channel PhonoVibe D and the Eco X bench quote 20 kHz against a 48 kHz rate, with Nyquist at 24 kHz. A datasheet claiming bandwidth equal to half the sample rate is a warning sign, not a feature.
Choosing a channel that cannot lie: a short checklist
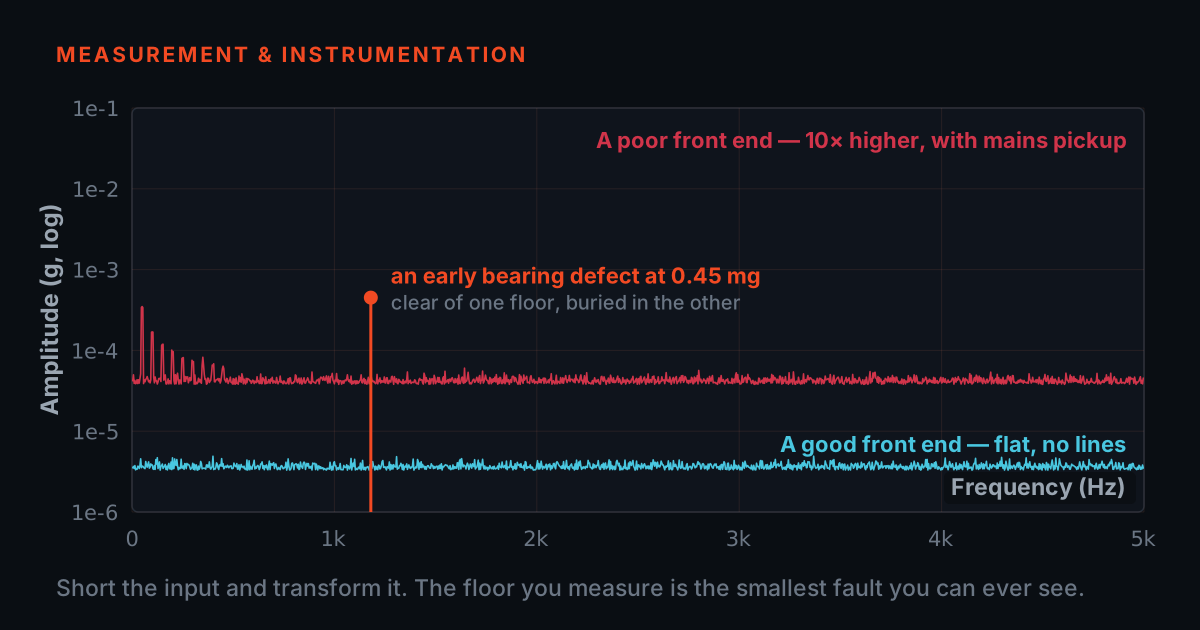
Bandwidth honesty first: specified bandwidth comfortably below half the sample rate. Then simultaneous sampling — multiplexed channels corrupt cross-channel phase and quietly invalidate FRFs and coherence. Every PhonoVibe model, from the 2-channel D to the 16-channel HD, samples all inputs simultaneously with a 24-bit ADC per channel, and 24-bit range means small bearing tones stay visible next to large 1x components without gain juggling.
The rest of the chain matters equally: clean 24 V, 4 mA IEPE excitation (built into PhonoVibe; the TSP 02 and TSP 04 conditioners provide the same at unity gain, 0.5 Hz to 50 kHz, for instruments without it), a sensor matched to the job — such as the AC153-1D low-frequency accelerometer for machinery below 10 Hz — low-noise coaxial cable (CA-101 type) against triboelectric noise, and TEDS recognition to kill manual sensitivity-entry errors. The bundled TVIB TSAP 201 software then keeps sample rate, span, lines and averaging under your control rather than behind an auto mode.
Case study: commissioning a gearbox test cell
A representative workflow, not a specific customer: a reliability team instruments a motor-gearbox rig running near 2,980 RPM — shaft rate just under 50 Hz, a 23-tooth pinion putting gear mesh around 1.14 kHz with harmonics above that. A 4-channel PhonoVibe Q (128 kHz sampling, 0.5 Hz to 60 kHz bandwidth) is wired with IEPE accelerometers on low-noise coaxial cable at the bearing housings.
They capture in two passes, as sketched below — a wide survey to confirm where the energy really is, then a fine-resolution zoom on the mesh region so sidebands at the 50 Hz shaft spacing separate cleanly. One commissioning habit worth copying: if a suspicious line appears, re-capture at a different sample rate. A real component stays put; an alias moves, because its apparent frequency depends on the fold.
Where to learn this properly
The theory here — sampling, folding, FFT resolution, windowing — is covered in TIERA's free primers at 101.tieraonline.in: Signal Processing 101 and Accelerometer & DAQ Selection 101. They are free introductory courses for onboarding and refreshing fundamentals, not accredited ISO certifications.
For formal, assessed competence in vibration analysis, TIERA runs the TCAT programme — details on the services page at /services — with proctored examinations at exams.tieraonline.in. A sensible path: primers first, hands-on time with a DAQ and a known signal source, then the formal programme when certification matters.
TIERA instruments that do this work.

PhonoVibe Series — Sound & Vibration DAQ
Quotes usable bandwidth well below Nyquist — 0.5 Hz – 60 kHz at 128 kHz on the Q/O/HD — a genuine guard band for the anti-alias roll-off, not a 'half the sample rate' promise.
- ADC resolution
- 24-bit
- Sampling (Q/O/HD)
- 128 kHz
- Bandwidth (Q/O/HD)
- 0.5 Hz – 60 kHz
- Bandwidth (D, 2-ch)
- 2 Hz – 20 kHz at 48 kHz
- Sensor power
- 24 V, 4 mA (IEPE/ICP/CCLD)
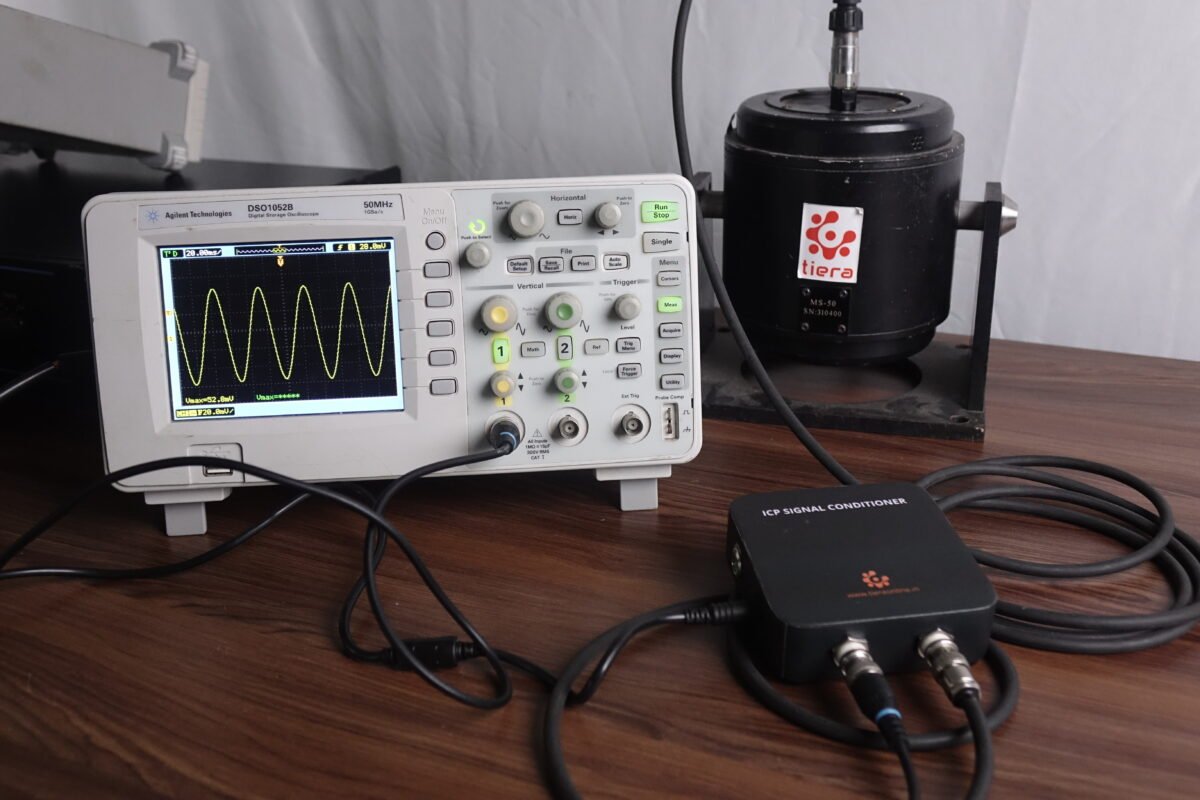
TSP Series IEPE Signal Conditioners
Clean constant-current excitation at unity gain for front ends without built-in sensor power, so the noise floor is set by the sensor — not the supply.
- Excitation
- 24 VDC, 4 mA constant
- Frequency response
- 0.5 Hz – 50,000 Hz
- Gain
- 1 (unity)
- Connectors
- BNC in / BNC out

T-Calibro Vibration Calibration System
A front end you never second-guess also needs a known sensitivity: back-to-back verification of your accelerometers on your own bench, with certificates from the bundled software.
- Method
- Back-to-back comparison
- Reference frequency
- 159.2 Hz (ISO 16063 convention)
- Compatibility
- All IEPE/ICP accelerometers
- Records
- Automated certificate generation
From the TIERA store
The kit for this job
What we would actually put in front of someone doing the measurement this post describes — not the whole catalogue.
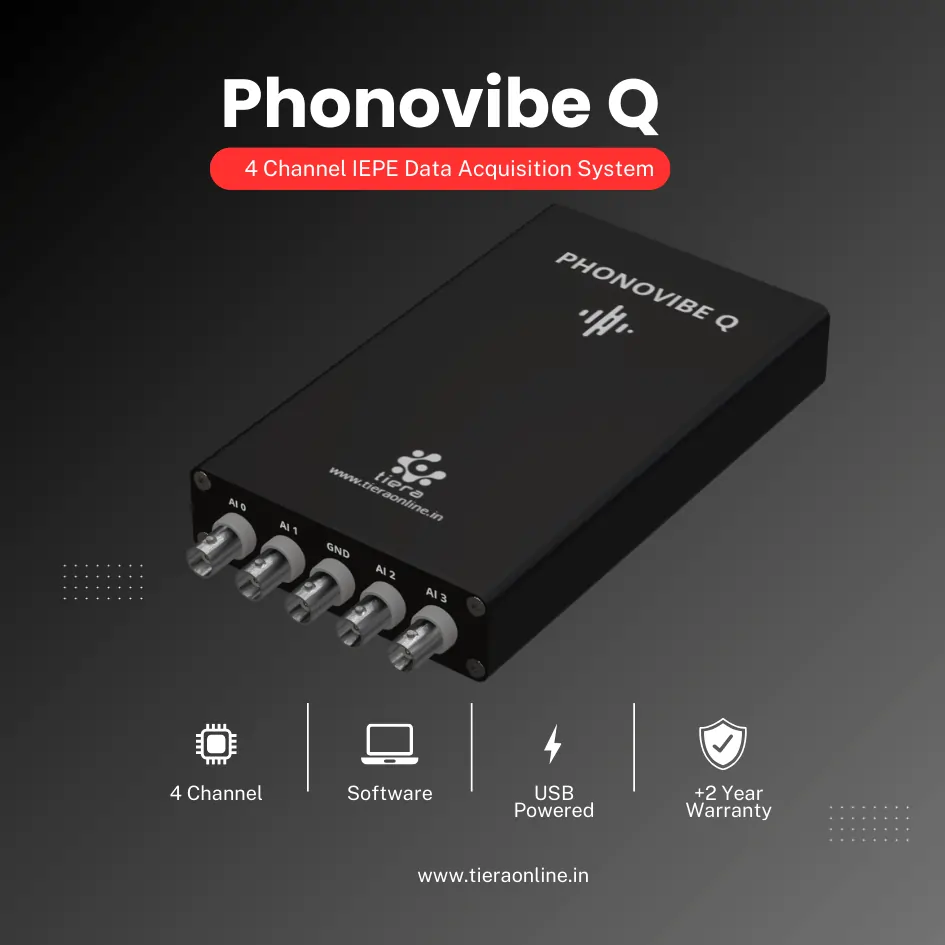 4 Channel IEPE Data Acquisition System – Phonovibe QFour Channels Standard plug & play USB Powered Take data from accelerometers, microphones, hammers, or any other IEPE Sensors T- VIB Software to acquire time waveforms, frequency spectra, overall vibration levels, FRF’s and octave measurements ** Windows 10 or above Operating System ** T-VIB Software base version comes with Time and Spectrum with Post processor TSAP 201. Check out TVIB Software regarding more module options.₹2,88,000View →
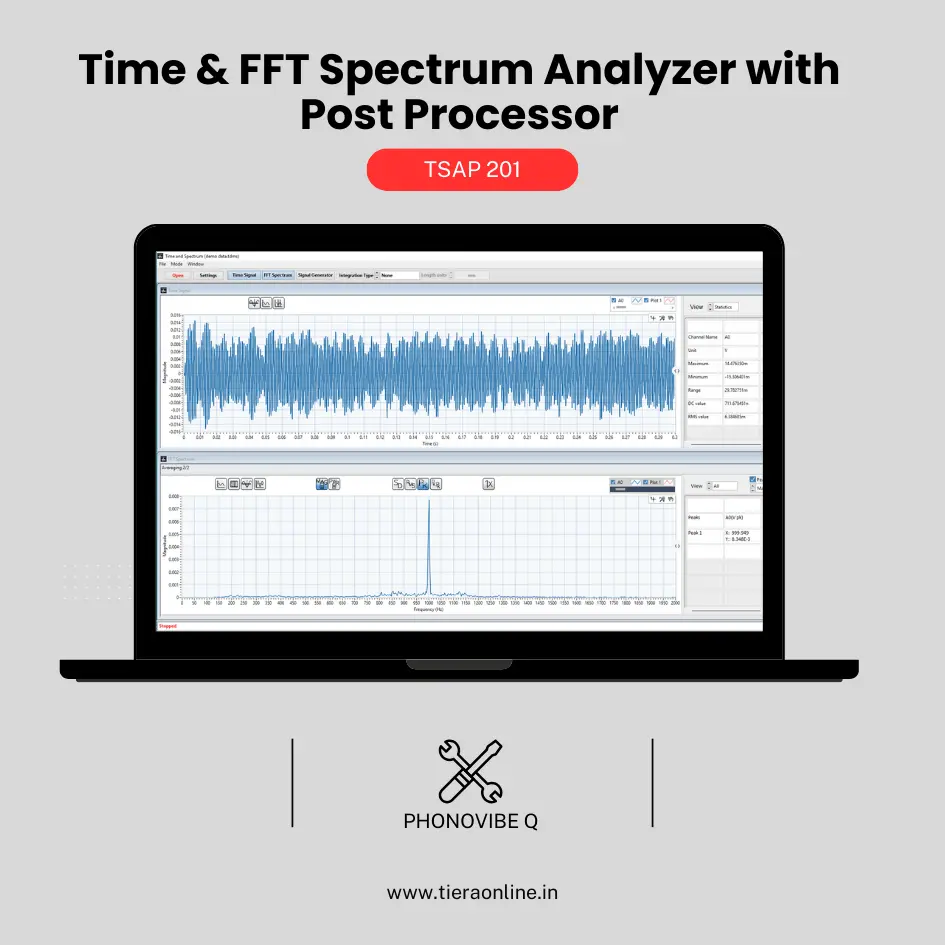 TSAP 201 -Time & FFT Spectrum Analyzer with Post Processor (Phonovibe Q)Use Cases Bump Test Product Development Off route Machine Vibration analysis. Drop Test Product Development & Research₹34,560View →
Measure with a front end you never have to second-guess
The checklist in this post is how TIERA specifies its own hardware. Every PhonoVibe DAQ quotes its usable bandwidth below Nyquist — the 4-, 8- and 16-channel Q, O and HD sample at 128 kHz and specify 0.5 Hz to 60 kHz; the 2-channel D specifies 2 Hz to 20 kHz at 48 kHz — leaving a genuine guard band for the anti-alias roll-off instead of promising 'half the sample rate'. All models are 24-bit with simultaneous sampling on every input, so the cross-channel phase your FRFs and coherence depend on survives capture.
A channel you can trust also needs clean excitation and a known sensitivity. PhonoVibe builds in 24 V, 4 mA IEPE/ICP/CCLD power with TEDS recognition; for instruments without sensor power, the TSP 02 and TSP 04 conditioners supply the same excitation at unity gain from 0.5 Hz to 50 kHz. Every DAQ ships with a factory calibration certificate, and the T-Calibro back-to-back calibrator lets you verify accelerometer sensitivities on your own bench against a traceable reference, with certificates generated by its software.
- PhonoVibe Q / O / HD — 128 kHz sampling with 0.5 Hz to 60 kHz specified bandwidth: a real guard band below the 64 kHz Nyquist limit
- 24-bit ADC and simultaneous sampling on every channel, from the 2-channel D to the 16-channel HD — no multiplexing, no phase corruption
- Built-in IEPE/ICP/CCLD excitation (24 V, 4 mA) and TEDS; TSP 02 / TSP 04 conditioners extend the same to third-party instruments
- Factory calibration certificate with every unit, plus the T-Calibro back-to-back calibration system for in-house sensor verification
Where this sits on the TIERA learning ladder.
The theory behind this article is covered free, in full, by the TIERA 101 primers: Signal Processing 101, Accelerometer & DAQ Selection 101. They are self-paced, interactive, and end in an exam and a certificate.
The free 101 primers teach the sampling and FFT theory; the formal TCAT programme (see /services) adds structured coursework and proctored examinations at exams.tieraonline.in for teams that need assessed, certificated competence.
TIERA 101 is a free introductory primer, not an accredited ISO certification, and its hours do not count towards the formal training ISO 18436 requires.